Current article and correction history
Sri Lanka Telecommunications Market Audit
Kushan Liyana Arachchige · Research Mind
Edition e03/s01 · Evidence checked through 2026-09-11. Original publication: 2025-06-23.
This frozen manuscript preserves the cited edition, including its contemporary limitations. Consult the current article for subsequent changes.
Sri Lanka’s telecommunications market is carrying more data through a largely stable broadband subscription base. The monthly series shows a sharp increase early in 2026 followed by slower growth. Operator earnings improved over the half-year, while SLT’s Q2 cost comparison became less favourable. Internet participation also broadened: reported gains were larger in rural and estate communities than in urban areas.
The next competitive gains depend on converting this demand into reliable, usable service. Customers face different installation payments, contract commitments and local availability across wireless, fibre and satellite access. Distribution and repair capacity therefore matter alongside network investment. For operators, higher traffic supports the investment case only when revenue and operating contribution cover the additional cost of delivery.
- 46.7% more mobile data traffic in July than January 2026; fixed traffic rose 11.5% (E1).
- LKR 6,990 advertised connection price, with its tax basis unspecified, in the selected Dialog online offer (E2).
- 6.4 percentage points narrower urban–estate internet-use gap between the H1 2024 and H1 2025 survey estimates (E5).
- Three independently owned mobile operators in the inspected licence register; a continuing brand does not necessarily add a separate network competitor (E7).
E0. Market boundary and observation periods
This audit covers licensed fixed, mobile, satellite, data and internet connectivity supplied to households and businesses in Sri Lanka. Wholesale capacity, international links and shared infrastructure are inputs; their value is not added again to retail spending. Device sales, television programming and standalone applications sit outside the market boundary. Integrated-group accounts are used at their reported scope.
This market review does not assess alleged scam operations or payment losses. The fraud-specific use of caller-number and subscriber-identity provisions is examined in Telecom-Enabled Fraud in Sri Lanka: 2026 Evidence Review.
The classification anchors are ISIC Rev. 4 6110, wired, 6120, wireless, 6130, satellite and 6190, other telecommunications, restricted here to the stated connectivity activities.
Evidence checked through 11 September 2026 under methodology 1.1.0. Historical welfare, wages and household-use surveys provide the baseline; operator accounts cover January–June 2026; traffic observations cover each month from January to July. Policy decisions, inflation and dated September offers retain their own periods. Household and individual observations are distinct from integrated-company outcomes.
E1. The connection base
Sri Lanka’s growth in data traffic substantially exceeded growth in broadband connection counts between January and July 2026. TRCSL’s provisional monthly sheets show:
| Subscriptions | January 2026 | July 2026 | Change |
|---|---|---|---|
| Fixed access | 2,724,251 | 2,712,572 | −0.43% |
| Cellular mobile | 29,649,146 | 29,530,304 | −0.40% |
| Fixed broadband | 2,024,513 | 2,024,699 | +0.01% |
| Mobile broadband, 3G/4G/5G | 21,991,606 | 21,994,161 | +0.01% |
| Satellite broadband | 5,461 | 8,952 | +63.93% |
Categories overlap; subscriptions count connections rather than unique people. Sources: TRCSL, January 2026, July 2026, statistical-overview panels.
Reported mobile data traffic increased from 251,445 to 368,978 TB, or 46.7%; fixed traffic increased from 137,218 to 153,031 TB, or 11.5%. Both endpoint months contain 31 days. Satellite added 3,491 subscriptions from a small base. TRCSL monthly usage panels
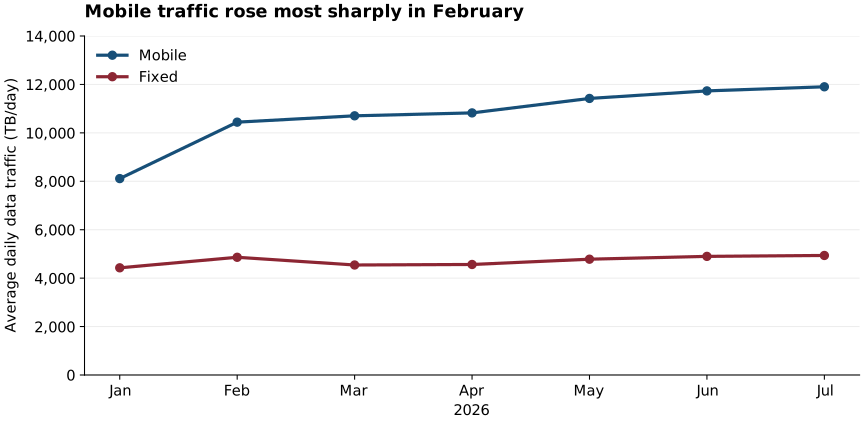
Monthly traffic divided by calendar days; provisional, without seasonal adjustment. Download the seven monthly observations and source links.
The intervening months change the interpretation. Average daily mobile traffic rose 28.7% in February, then increased by 1.1–5.5% per month through July. April and June had lower monthly totals than their preceding months, but higher daily averages. July was the highest observed endpoint in a continuing increase, rather than the start of an acceleration. Fixed traffic was less consistent, falling on a daily basis in March before increasing through July. The series is too short to distinguish recurring seasonal effects; a comparable year-on-year monthly series was not located in the inspected TRCSL monthly release index.
Higher traffic raises the question of where extra capacity is required. It does not measure capacity utilisation, which needs a capacity denominator. Investment can increase supply faster than traffic grows, and congestion depends on location and busy-hour demand. The commercial question is whether additional delivery earns enough contribution to sustain investment and service quality.
E2. Macroeconomic conditions and affordability
Real income recovery and renewed price increases
Sri Lanka’s economy grew 5.0% in 2025. CBSL reports public-sector wages rising 14.9% in nominal terms and 14.7% in real terms that year. This establishes an improvement in that group’s purchasing power during 2025, rather than recovery for every household or restoration of pre-crisis living standards. The private-sector statutory monthly minimum reached LKR 30,000 in January 2026. CBSL, Annual Economic Review 2025, Chapter 1
The preceding welfare loss was substantial. The World Bank’s April 2025 assessment estimated poverty at 24.5% in 2024, compared with 11.3% in 2019, using USD 3.65 per person per day in 2017 PPP. Food prices more than doubled between 2021 and 2024. These historical observations locate the subsequent recovery against a much higher cost of essentials. World Bank, Staying on Track, pp. 26–29
The CCPI increased from 195.8 in December 2025 to 208.8 in August 2026: a 6.64% cumulative price increase, equivalent to 6.23% less purchasing power for unchanged nominal income. August headline inflation was 8.0% year on year, but the monthly increase was 0.28%; CBSL attributed the rise in annual inflation principally to a food-price base effect. The index covers the overall urban Colombo consumer basket, including communication. CBSL, August 2026 inflation release, pp. 1–2
Recurring expenditure and the initial financing requirement
The comparison below selects the four volume-based, anytime postpaid Home Wi-Fi offers on Dialog’s page on 10 September 2026. Speed-limited unlimited and application-specific offers are outside this selection. The benchmark is one worker’s LKR 30,000 gross monthly statutory wage; a home connection may serve several people and be financed by multiple earners. Dialog, advertised packages; CBSL, wage benchmark
| Allowance | Monthly charge, tax inclusive | Monthly wage share | Connection + one month | Connection + 12 months | First-year expenditure / annual gross wage |
|---|---|---|---|---|---|
| 65 GB | LKR 1,593 | 5.31% | LKR 8,583 | LKR 26,106 | 7.25% |
| 100 GB | LKR 2,334 | 7.78% | LKR 9,324 | LKR 34,998 | 9.72% |
| 140 GB | LKR 3,075 | 10.25% | LKR 10,065 | LKR 43,890 | 12.19% |
| 175 GB | LKR 3,693 | 12.31% | LKR 10,683 | LKR 51,306 | 14.25% |
Illustrative expenditure at unchanged advertised prices, treating the LKR 6,990 online connection offer as the connection expenditure. The offer does not specify its tax basis; the illustration assumes no further connection tax. Any additional connection tax would increase both connection-inclusive totals by that amount. Annual gross wage: LKR 360,000. Totals include only that connection price and the stated subscriptions; equipment outside the offer, refundable advances, electricity and additional usage are excluded. Connection plus one month measures first-month expenditure, rather than cash necessarily payable at activation. Totals are not verified checkout amounts or disposable-income ratios.
For 65 GB, the first-year monthly equivalent is LKR 2,175.50. The connection-plus-one-month amount absorbs 28.61% of the wage benchmark, compared with the recurring 5.31%. The LKR 6,990 connection charge itself creates a potential liquidity constraint; an applicable refundable rental advance would increase initial cash requirements without adding to expenditure. Calculations from Dialog’s advertised charges
Postpaid charges are invoiced at month-end. Dialog’s general broadband terms specify a 24-month commitment unless the registration form states otherwise, customer purchase of equipment subject to discounts, and the right to collect one month’s rental in advance, settled against dues or refunded at termination. Offer-specific registration determines the applicable equipment price and commitment. Dialog, broadband terms, clauses 1, 3 and 6, including 6.xiv and 6.xxi
Customer expenditure includes substantial billing additions
Dialog’s guide reports effective additions of 23.50% for data and 42.02% for domestic voice and specified value-added services, including recovery in lieu of the Social Security Contribution Levy (SSCL). A LKR 1,000 tax-inclusive budget therefore corresponds to LKR 809.72 or LKR 704.13, respectively, before these additions. These are effective billing additions rather than single statutory tax rates. The distinction separates money paid by customers from the underlying service charge; package-to-wage comparisons above use the advertised final rental. Dialog, tax guide
Financing and energy changes have different transmission periods
CBSL increased its policy rate by 100 basis points to 8.75% on 26 May 2026, retaining that rate in July. PUCSL’s 18% increase for categories including General Purpose 2 and 3 took effect on 11 May. These changes overlapped only part of H1; borrowing resets and facilities’ billing categories determine their timing and exposure. CBSL, May decision; July decision; PUCSL, May announcement
CBSL’s July review recorded monthly current-account deficits from April as fuel-import expenditure increased and tourism earnings weakened, despite strong remittances. Imported energy therefore raises both domestic operating costs and demand for foreign currency. For telecommunications procurement, pressure on foreign-currency availability can affect overseas supplier payments, while depreciation increases the rupee cost of unhedged equipment purchases. CBSL, July review
| Illustrative sensitivity—not measured operator exposure | Assumption | Calculated change |
|---|---|---|
| Historical equipment procurement | USD 10m at year-end rates of LKR 292.58/USD in 2024 and 309.99 in 2025 | LKR 174.1m more; +5.95% |
| Annual interest | LKR 10bn floating-rate debt; full 1-percentage-point repricing | LKR 100m more annually |
| Eligible electricity expenditure | LKR 1m bill; uniform 18% proportional increase | LKR 180,000 more |
Exchange-rate inputs: CBSL, 2025 review, pp. 53–54. The electricity consumption-only offset is 15.25%, assuming fully proportional billing. Fixed and demand charges alter that relationship; cost absorption, sourcing changes and investment are other possible responses.
E3. Regulation and accountability
The 12 August 2025 broadband rules set these per-user field-test targets:
| Service | Download | Upload |
|---|---|---|
| Mobile UMTS/LTE | >2 Mbps | >1 Mbps |
| Fixed wireless LTE | >4 Mbps | >1 Mbps |
| Fixed fibre | >4 Mbps | >2 Mbps |
These are regulatory test targets, not advertised package speeds or measured operator results. Tests use specified files and a TRCSL-designated remote server; technical limitations preventing achievement must be disclosed. For fixed wired and wireless services, the connection-supply targets are 70% of orders within seven days and 95% within one calendar month. Fault-repair targets exceed 70% within 24 hours, 80% within 48 hours and 90% within 96 hours. Broadband Quality of Service Standard Rules No. 01 of 2025, English pp. 25A, 28A–30A
Monthly and quarterly reports are due within 15 days of period-end. The rules require TRCSL to audit submissions and publish audited information periodically; the rules themselves do not demonstrate that these activities have occurred. Rule 9 expressly enumerates UMTS, LTE, copper and fibre. The displayed LTE targets should therefore not be treated as a complete 5G quality framework. Rules 9–14, English p. 2A
These obligations have commercial consequences. Installation and repair times depend on field-service staffing, spare equipment and access to premises, creating operating costs as well as opportunities to retain customers. Comparable published results could make reliability and repair performance more observable when customers choose providers. That is an economic implication of the reporting framework; measured compliance would require the audited results.
E4. Earnings and quarterly cost pressure
Company-reported consolidated results, H1 2026
EBITDA denotes earnings before interest, tax, depreciation and amortisation.
| Group measure | Dialog | SLT |
|---|---|---|
| Revenue | LKR 95.5bn; +9% | LKR 61.314bn; +11.1% |
| EBITDA | LKR 50.0bn; +23% | LKR 24.126bn; +13.7% |
| EBITDA margin | 52.3%, reported | 39.3%, calculated |
| Profit after tax | LKR 19.3bn; more than doubled | LKR 6.601bn; +54.4% |
Sources: Dialog, 14 August release; SLT, 17 August release. All growth figures are year on year. Consolidated scopes include activities beyond retail telecommunications. Margins are not an efficiency ranking without reconciling business mix and accounting treatment.
SLT’s more recent quarter complicates the positive half-year picture:
| Year-on-year growth | H1 2026 | Q2 2026 |
|---|---|---|
| SLT group revenue | 11.1% | 11.7% |
| Group operating expenses, excluding depreciation and amortisation | 9.6% | 12.2% |
| Mobitel revenue | 12.9% | 16.0% |
| Mobitel operating expenses | 11.0% | 18.0% |
Operating expenses grew faster than revenue in Q2 at both levels. SLT’s quarterly EBITDA margin was approximately 39.19%, compared with 39.47% a year earlier, reconstructed from rounded growth rates: a decline of about 0.28 percentage points. This indicates modest quarterly margin pressure. Management cited currency, fuel, utilities and network-related expenses; the figures do not isolate their individual contributions. SLT company release
Dialog’s reported profit included foreign-exchange gains; excluding them, profit was LKR 18.8bn. Management also attributed earnings growth to lower net finance costs and operating improvements. Capital expenditure reached LKR 18.5bn, principally for 5G deployment. These disclosures identify financing and treasury effects alongside revenue and operating-cost changes. Dialog company release
E5. Customers, devices and unequal participation
DCS surveyed 12,500 households in January–June 2025, covering persons aged 5–69.
| Residential sector | Internet use, persons aged 5–69 | Households with a desktop or laptop |
|---|---|---|
| Sri Lanka | 60.4% | 21.4% |
| Urban | 71.9% | 36.3% |
| Rural | 58.8% | 18.9% |
| Estate | 45.6% | 5.8%† |
Internet use means at least once during the preceding twelve months, not daily connectivity. Household computer ownership excludes smartphones. † DCS flags this estimate for high sampling variability. Source: DCS, Computer Literacy Statistics 2025, first six months, Tables 1 and 8, pp. 1 and 4.
Participation is unequal, but the published estimates show the gap narrowing:
| Residential sector | Internet use, H1 2024 | Internet use, H1 2025 | Change |
|---|---|---|---|
| Urban | 67.8% | 71.9% | +4.1 percentage points |
| Rural | 51.4% | 58.8% | +7.4 percentage points |
| Estate | 35.1% | 45.6% | +10.5 percentage points |
The urban–estate gap fell from 32.7 to 26.3 percentage points, a 6.4-point narrowing. Reported participation increased more in rural and estate communities. These are descriptive changes between the bulletin’s estimates; Table 8 alone does not establish statistical significance. DCS, Table 8
The computer-ownership disparity matters for activities requiring a larger screen, keyboard or specialist software. Access, suitable devices and skills are complementary inputs. Van Deursen and van Dijk’s study of material access explains why device diversity and the costs of maintaining access matter beyond an internet connection. Its Dutch findings inform this mechanism, without supplying an effect estimate for Sri Lanka. Van Deursen and van Dijk, 2019, New Media & Society, 21(2), 354–375
E6. Delivery channels, suppliers and partners
Acquiring and maintaining a connection
Digital ordering reduces some transaction steps, but activation still depends on identity and location. Dialog’s online home-broadband journey checks the delivery address and coverage and requires identity verification. Its website also provides retailer activation and order tracking. Dealers offer an assisted acquisition channel; the inspected pages do not disclose dealer commissions or the proportion of connections sold through each channel. Dialog ordering; retailer and customer-service links
Payment and support continue after acquisition. MyDialog supports multiple connections, card payments and several interface languages. SLT provides MySLT account management and advertises more than 3,000 authorised bill-payment locations alongside digital payment methods. Physical collection points can serve customers who do not use card-based self-service, while apps can reduce routine billing contacts. Neither channel removes the need for field support when the access connection fails. MyDialog; SLT payment channels
Installation and upstream dependencies
Fibre delivery requires a serviceable route to the premises and installed optical equipment; SLT’s connection offer includes an optical network terminal and telephone. Fixed wireless substitutes a radio access link and router for that final fibre connection, making signal conditions and equipment placement important. A successful online sale therefore depends on a physical delivery process. Capacity in installation and repair teams can constrain growth even where demand exists. SLT connection conditions; Dialog coverage qualifications
Upstream connectivity also shapes the service sold. SLT describes its enterprise IP VPN as running over a shared IP/MPLS backbone and its business internet as connecting to overseas ISPs. Its enterprise catalogue directs customers to account managers for integrated solutions. Operating a shared backbone can spread infrastructure costs across services and support a broader enterprise offer; access to alternative routes and wholesale suppliers influences resilience and procurement choices. These are mechanisms inferred from the disclosed service architecture, without an estimate of wholesale margins or bargaining power. SLT networking; business internet; enterprise channels
TRCSL separately licenses international gateways, including those of several retail groups and TATA Communications Lanka. These permissions identify authorised upstream participants; they do not establish actual capacity, wholesale prices or extra retail mobile competitors. TRCSL system-licence register
E7. Competition and alternatives
The Dialog–Airtel transaction changed ownership and reporting boundaries. Dialog announced that Airtel Lanka ceased as a separate corporate entity on 30 August 2024, with Dialog surviving the amalgamation and absorbing its operating results. The Airtel brand continued within that structure. A separately marketed brand therefore did not represent a separately owned network competitor. Dialog amalgamation announcement, 30 August 2024
The regulator’s register lists three mobile operators and two fixed operators. Ownership counts describe structure; competitive pressure depends on the alternatives available to a particular customer. The following purposive comparison selects one volume-based home offer from Dialog, one entry fibre offer from SLT and one residential satellite offer. It examines substitution across access technologies, rather than ranking all providers or mobile tariffs. TRCSL licence register
Selected advertised offers, observed 11 September 2026. All prices are LKR.
| Dimension | Dialog Home Wi-Fi 65 GB | SLT Fibre Starter | Starlink Residential Lite |
|---|---|---|---|
| Monthly charge | 1,290 before tax; 1,593 including tax | 2,690 plus tax | 9,200 displayed; tax treatment not established in the inspected offer |
| Initial equipment / connection | 6,990 online connection offer; tax basis unspecified | 12,500 excluding tax, Fibre Double Play connection with ONT and telephone | Hardware starting at 69,000 in selected areas; address-specific equipment and delivery quote required |
| Usage and speed conditions | 65 GB anytime; unused-data rollover | 80 GB; advertised 100 Mbps down / 50 Mbps up; free night-time period midnight–7 am | Unlimited data; lower priority and slower service at peak times; availability restricted by area |
| Practical availability | Address and coverage check; indoor signal conditions matter | Fibre must be serviceable at the premises; installation required | Address eligibility and a suitable terminal location required |
| Commitment and switching | General terms specify 24 months unless registration states otherwise; equipment and advance provisions apply | Ordinary fibre: 12 months; early termination charge 1,000 per remaining month | Advertised 30-day trial; ongoing cancellation and complete checkout terms not verified |
| Quality evidence used here | Advertised offer and coverage guidance | Advertised offer and installation terms | Advertised service conditions; no matched Sri Lankan performance test |
Sources: Dialog offers, ordering and terms; SLT packages and connection charges; Starlink Sri Lanka residential and service plans. SLT’s zero package startup fee is distinct from its physical connection charge. The columns retain each source’s tax basis; they are not equivalent tax-inclusive totals. Voice rental, optional equipment, delivery, electricity and extra usage may add expenditure.
The alternatives impose different constraints. A customer with light usage may value a lower recurring rental; an upload-intensive household may value the fibre speed proposition if installation is feasible. A large advertised allowance or unlimited data does not make services equivalent when speed, priority or local availability differ. E2’s connection-cost example also shows why a household can afford recurring use yet struggle to finance entry.
Switching requires more than choosing a cheaper rental. A second installation, equipment replacement, any remaining commitment and the risk of disruption can offset prospective savings. The stated contract provisions provide concrete sources of switching costs, but churn data would be needed to measure their effect on competition. For an existing customer, the relevant comparison is prospective expenditure from today, including termination costs; a previously paid, non-refundable connection charge is a sunk cost.
Klemperer’s review explains why switching costs can create different incentives when firms seek new customers and serve an existing customer base. This supports examining entry offers and continuing terms together; it does not establish the size of that effect in Sri Lanka. Klemperer, 1995, The Review of Economic Studies, 62(4), 515–539, abstract
Satellite has a distinct commercial role where a usable terrestrial connection is unavailable or where a separate access path is valuable. Its higher initial payment and recurring rental in this selection narrow the circumstances in which it substitutes for the terrestrial offers. It can also complement them as a backup, subject to site and power requirements. Subscription growth alone cannot establish its effect on terrestrial prices or market power.
E8. Technology and transition
The December 2025 spectrum allocation concentrated the initial 5G awards in two operators:
| Award recipient | Frequency block | Bandwidth |
|---|---|---|
| Dialog Axiata | 3,400–3,500 MHz | 100 MHz |
| Sri Lanka Telecom Mobitel | 3,500–3,600 MHz | 100 MHz |
| Dialog Axiata | 27,200–27,400 MHz | 200 MHz |
Source: TRCSL award notice, 19 December 2025. These are assigned spectrum blocks; bandwidth in different bands is not an interchangeable measure of geographical coverage.
Dialog’s launch announcement the previous day described over 220 live 5G sites, positioning 3,500 MHz for wider-area mobile service and 27 GHz for high-capacity applications. It also announced a USD 100 million investment plan over two years. The plan is a company commitment, distinct from expenditure already incurred. Dialog 5G launch, 18 December 2025
Dialog’s later H1 2026 results release reported more than 1,000 live 5G sites. Neither site count establishes population or geographical coverage, active 5G use or experienced service quality. Dialog H1 results, 14 August 2026
Technology changes the feasible service proposition through installation, equipment and the access bottleneck:
| Access route | Customer requirements | Commercial implication |
|---|---|---|
| Fibre | Serviceable physical connection, ONT and installation; local Wi-Fi or wired devices must support the intended use | A larger initial installation commitment can support the selected offer’s higher advertised upload speed; local network equipment can still limit experience. |
| Fixed wireless | Compatible router, available radio coverage and suitable placement; an outdoor installation may be needed | Avoids a fibre drop at the premises, but usable service depends on radio conditions and shared demand. A 5G network announcement does not upgrade an incompatible router. |
| Satellite | Eligible service address and terminal installation | Extends the choice of access path, with a different equipment cost and priority regime; practical suitability must be checked at the site. |
The table interprets the SLT connection offer, Dialog coverage guidance and Starlink offer alongside E7’s dated comparison. It is not a measured performance ranking.
Additional capacity can accommodate demand, but its return depends on where customers need service, compatible equipment and the packages they buy. Capacity investment has substantial shared costs: carrying more traffic can lower average cost when spare capacity exists, while expansion, energy and maintenance can increase total costs. Both outcomes are consistent with E1’s traffic growth; they must be distinguished using revenue, contribution and service-quality evidence.
E9. Outlook and scenarios
Monitoring horizon: September 2026 to September 2027. These pathways identify conditions to observe, without assigning probabilities or forecasting numerical outcomes. They can coexist across operators and customer groups.
| Pathway | Evidence supporting it | Evidence weakening it | Monitoring basis |
|---|---|---|---|
| Traffic growth supports earnings | Comparable service revenue and operating contribution increase while delivered quality is maintained | Traffic rises without sufficient contribution growth, or quality deteriorates as demand grows | Monthly TRCSL traffic; quarterly operator revenue, EBITDA and cash flow; comparable quality results when published |
| Cost pressure constrains investment | Operating margins and cash generation weaken as costs rise; investment delivery slows | Revenue or efficiency gains offset costs and planned delivery continues | Matched quarterly and half-year accounts; capital expenditure and deployment disclosures; financing and energy changes |
| Participation broadens | Internet adoption rises among underserved groups alongside usable coverage and affordable entry | Deployment grows without broader participation, or entry and device costs remain prohibitive | Next comparable DCS residential-sector estimates; dated connection and rental terms; location-specific coverage evidence |
Use matched reporting scopes and compare like periods. A single quarter may be affected by seasonality, accounting changes or temporary disruption; sustained changes across successive releases provide stronger evidence. The household pathway may remain unresolved within the horizon if a comparable survey is not released. The monitoring record should then retain the last observation rather than infer adoption from deployment.
Revenue per GB is an informative price-and-mix indicator, but it is not a sufficient success measure. It can decline while total contribution improves if volume grows and costs increase more slowly. Conversely, higher total revenue can accompany weaker cash generation. Pricing, traffic, operating costs, investment and service quality need to be interpreted together.
E10. Opportunities, threats and critical success factors
The opportunity lies in serving greater data use and customers whose device and payment constraints shape the service they can buy. Network investment supports that opportunity when usable capacity reaches the locations and applications generating demand. Cost escalation creates a competing pressure on margins and customer prices; connection payments can constrain initial cash even when monthly rental is manageable.
| Critical success factor | Mechanism and intended outcome | Monitor against E9 |
|---|---|---|
| Reliable authorised delivery | Adequate installation and repair capacity turns network availability into usable service and reduces reasons to leave | Installation and repair distributions, comparable throughput and retention; earnings pathway weakens if quality falls |
| Sustainable customer value | Manageable entry payments, suitable devices and accessible payment/support channels help households acquire and maintain service | Prospective total expenditure and adoption across residential sectors; participation pathway needs observed use |
| Investment matched to demand | Site and access investment addresses demonstrated demand while operating contribution and cash generation finance expansion | Revenue, contribution, cash flow and deployment together; measure utilisation only where a matching capacity denominator exists |
| Inspectable performance | Stable definitions and comparable quality reports make financial trade-offs and customer alternatives assessable | Reconcile scope and period changes before interpreting any pathway; record missing releases rather than manufacture freshness |
These factors retain the audit’s four analytical identities. They specify mechanisms and outcomes rather than numerical weights or certifications of operators. Their usefulness can be tested against the stated horizon: stronger participation and service quality with sustainable delivery support them; persistent divergence between expenditure, paid demand and experience requires revisiting the investment or delivery assumptions.
E11. Assessment and future research directions
The market combines rising usage, improving half-year earnings and broader household participation with uneven local choices. The monthly traffic pattern is sustained but slower after February; the household gap is narrowing but remains substantial. Neither result establishes that investment has reached every underserved group or that additional traffic is profitable everywhere.
The competitive mechanisms are more concrete than operator counts alone suggest. Installation capability, assisted and digital channels, upfront financing and commitment terms influence which services customers can acquire and keep. Fibre, fixed wireless and satellite offer different combinations of cost and practical availability. The next assessment should test whether these choices broaden participation while service revenue, contribution and delivery quality support continued investment.
Future research directions — Matched tariffs, household income and service-quality records could clarify adoption across income groups and districts. Linking investment to usable coverage would establish who benefits. Facility energy exposure and debt-reset schedules could quantify cost shocks; comparable customer shares and environmental measures would support further competition and sustainability analysis. The present evidence supports neither a national revenue total, an operator ranking, a causal merger effect nor a quantified forecast.
Edition record and citation
The original publication date remains 23 June 2025. Cite this revision as: Kushan Liyana Arachchige, Sri Lanka Telecommunications Market Audit, edition e03/s01, 11 September 2026, Research Mind. The frozen reading copies and exact manuscripts preserve the version used:
- Edition e03/s01 — 11 September 2026 · manuscript
- Edition e03/s00 — 11 September 2026 · manuscript
- Edition e02/s00 — 10 September 2026 · manuscript
Each edition has a manifest with its manuscript checksum. The supporting-assets record preserves the traffic figure and data, including the original asset URLs used by e03/s00. The current article retains subsequent corrections; an access date alone should not substitute for the edition identifier.
Source and calculation notes
Sources accessed 9–11 September 2026. E2 retains its 10 September tariff observation; E7 records a separate 11 September comparison. Undated web offers and terms reflect their observation dates. Financial results are drawn from the identified company releases; the SLT citation now links to the company’s own website.
| Source and locator | Period / definition | Reproduction detail |
|---|---|---|
| CBSL Annual Economic Review 2025, printed pp. 12, 16, 53–54 | Annual wages; January 2026 wage floor; year-end LKR/USD | Public-sector real wage series; historical currency example holds USD cost fixed. |
| World Bank, Staying on Track, April 2025, printed pp. 26–29 | 2019–2024 poverty, 2017 PPP | This vintage was selected for the historical comparison; it is not presented as the latest welfare estimate. |
| CBSL August release, 31 August 2026, pp. 1–2 | CCPI level and monthly/annual changes | Cumulative: 100 × (208.8/195.8 − 1); purchasing power: 100 × (1 − 195.8/208.8). |
| Dialog package page and order page, offer cards | Advertised postpaid rentals, LKR; four anytime volume allowances | Dated transcription retained in the body table. Pre-tax rentals, in the same row order: 1,290; 1,890; 2,490; 2,990. These are selected observations, not a complete page archive. |
| Broadband terms, clauses 1.vi, 3.i, 6.xxi | General equipment, commitment and advance provisions | Package-specific equipment inclusion and actual advance remain unverified; the expenditure illustration excludes any refundable advance. |
| Dialog tax guide, service categories | Effective billing additions | Divide 1,000 by 1.235 or 1.4202. |
| Dialog H1 release, 14 August 2026, Group Performance and infrastructure sections | Consolidated H1 outcomes, LKR billions | Management explanations remain attributed. |
| SLT H1 release, 17 August 2026, H1 and Q2 sections | Group and Mobitel growth; LKR millions | Convert monetary amounts to billions; margin = 100 × 24.126/61.314. |
| CBSL May and July decisions; PUCSL May announcement | Policy dates and specified electricity categories | Interest: 10bn × 0.01; electricity: 1m × 0.18; consumption-only offset: 100 × (1 − 1/1.18). |
| TRCSL January 2026 and July 2026, overview/usage panels | Provisional connection stocks and monthly traffic; release dates unstated | Change = 100 × (July/January − 1). Traffic inputs retain source precision: January fixed 137,218.46 TB; mobile 251,445.37 TB. Endpoints have equal month lengths, without seasonal adjustment. |
| TRCSL quality rules, 12 August 2025 | English printed 2A, 25A, 28A–30A | Reporting, test and service-delivery targets; not measured compliance. |
| DCS 2025 first six months, Tables 1 and 8, printed 1 and 4 | Survey estimates: H1 2024 and H1 2025 | Urban–estate gaps: 67.8 − 35.1 = 32.7 points in H1 2024; 71.9 − 45.6 = 26.3 in H1 2025. Narrowing: 32.7 − 26.3 = 6.4 points. Person and household denominators stay separate. |
| TRCSL licensing; spectrum award, 19 December 2025 | Dated register observation and assigned blocks | Permissions and operator identities; not customer shares or coverage. |
| Dialog amalgamation, 30 August 2024; 5G launch, 18 December 2025 | Company announcements | Legal/brand structure, historic deployment and prospective investment plan retain their dates. |
Monthly traffic: daily average = reported TB / calendar days. Month-on-month daily growth = 100 × (current daily average / previous daily average − 1). The CSV retains source precision and all seven source URLs; the figure normalises month length but makes no seasonal or capacity adjustment.
Affordability calculations use monthly rental M and advertised connection C: recurring ratio = M/30,000; connection-plus-month = C + M; first-year expenditure = C + 12M; annual ratio = (C + 12M)/360,000. Percentage outputs multiply these ratios by 100. The first-year measure assumes continued subscription and unchanged prices, not a 12-month contractual term. C is assumed to be the full LKR 6,990 connection expenditure because the advertised connection tax basis is unspecified. If an additional connection tax T is payable, add T to C + M and C + 12M; the annual wage ratio increases by T/360,000 before multiplication by 100.
Calculated expenditure ratios are rounded to two decimal places. The comparison table rounds EBITDA margins to one decimal place. Unrounded SLT margins: H1 39.348%; Q2 39.191% = 100 × 11,960/30,517; reconstructed prior Q2 39.474% = 100 × (11,960/1.109)/(30,517/1.117). Approximate change: −0.283 percentage points, subject to rounded growth inputs. The tariff transcription preserves selected price observations, not complete archived pages or verified transaction totals.