report
Germany Telecommunications: Fibre Rollout and Take-up
Germany’s fibre deployment, activation and competition, with a reproducible denominator bridge, domestic operator finances and household contract costs.
- Status
- Published
- Published
- Reviewed
- Publisher
- Research Mind
- Author
- Topics
- Germany telecommunications · German telecom market · fibre broadband · FTTH · FTTB · homes passed · fibre take-up · broadband competition · Bundesnetzagentur · wholesale access
Cite this work
Reference tools
How to cite this work
Choose a referencing style, copy the formatted reference, or download citation data for a reference manager.
Citation target. This reference points to the stable arachchi.ge work record.
Selected style APA 7
Arachchige, K. L. (2026). Germany Telecommunications: Fibre Rollout and Take-up. Research Mind. https://www.arachchi.ge/works/germany-telecommunications-industry/
APA 7 is shown by default. The citation files below remain available when interactive controls are unavailable.
Download citation data
Arachchige, K. L. (2026). Germany Telecommunications: Fibre Rollout and Take-up. Research Mind. https://www.arachchi.ge/works/germany-telecommunications-industry/
Arachchige, K.L. (2026) Germany Telecommunications: Fibre Rollout and Take-up. Research Mind. Available at: https://www.arachchi.ge/works/germany-telecommunications-industry/.
Arachchige, Kushan Liyana. 2026. Germany Telecommunications: Fibre Rollout and Take-Up. Research Mind. https://www.arachchi.ge/works/germany-telecommunications-industry/.
Arachchige, Kushan Liyana. Germany Telecommunications: Fibre Rollout and Take-Up. Research Mind, 18 Sept. 2026, https://www.arachchi.ge/works/germany-telecommunications-industry/.
[1] K. L. Arachchige, “Germany Telecommunications: Fibre Rollout and Take-up,” Research Mind, Sep. 2026. [Online]. Available: https://www.arachchi.ge/works/germany-telecommunications-industry/
1. Arachchige KL. Germany Telecommunications: Fibre Rollout and Take-up [Internet]. Research Mind; 2026 Sep. Available from: https://www.arachchi.ge/works/germany-telecommunications-industry/
Abstract
Germany's telecommunications market is moving from copper towards fibre without a comparable expansion in the number of fixed broadband subscriptions. Between 2022 and 2025, active fibre connections rose from 3.4 million to 6.4 million, while the overall fixed broadband base increased from 37.5 million to 38.8 million. The central commercial question is therefore how deployment becomes an installed, paid-for and reliably delivered service. This audit connects Bundesnetzagentur's fibre deployment stages with technology substitution, domestic operator accounts, advertised service costs and household participation. Its principal contribution is a reproducible denominator bridge separating homes passed, premises connected and active connections. In 2025, active connections represented 61.5% of connected fibre premises but 23.6% of reported homes passed. These measures describe different stages of development; neither establishes why a particular household has not subscribed. A clarification of the homes-passed definition also limits comparison with earlier years. Operator evidence shows that revenue, margins and customer numbers can move in different directions, while national market shares conceal substantial differences in local network choice. A selected tariff calculation demonstrates the distinction between introductory pricing and the cost over a minimum contract term. The evidence supports an outlook centred on activation, customer retention, wholesale access and service delivery. It does not support a causal estimate of fibre demand, a national affordability threshold or a ranking of providers by household value. The accompanying observations and calculations make the findings reusable while preserving their definitions, periods and limitations.
Scholarly PDF
Download scholarly PDF · v1.0Cite this version when referring to the PDF. Check this article for corrections and later editions.
Research status
Evidence checked through . Methodology 1.1.0 · Coverage and limitations · Edition record.
On this page
A market increasingly shaped by migration
Germany’s fibre opportunity sits inside a mature broadband market. Active FTTH and FTTB connections grew by 88.2% between 2022 and 2025, calculated from the regulator’s rounded observations, while the total fixed broadband base grew by 3.5%. DSL lost connections and cable was broadly stable. These paths favour an interpretation centred on technology migration and competitive displacement. They offer much less support for a strategy that assumes every new fibre subscription represents a newly connected household.
The distinction matters for investment. A network can pass more premises before its connections are installed; an installed connection can remain inactive; an active subscriber can move between suppliers or technologies. Each stage changes a different part of the business. Treating them as interchangeable overstates the information contained in any single deployment headline.
This audit covers Germany’s retail fixed and mobile connectivity markets, the wholesale relationships that support them, and the domestic operating segments for which comparable evidence was inspected. The principal historical baseline is calendar 2022–2025. Selected 2026 regulatory and company releases provide dated context. Cloud services, devices and television enter the discussion where they affect reported telecom revenue or customer acquisition; they are not independently sized markets here. Operator fiscal periods are stated separately, and the evidence cut-off does not imply that every source reports up to September 2026.
The fixed market’s historical path
| Year-end observation, million connections | 2022 | 2023 | 2024 | 2025 |
|---|---|---|---|---|
| Total active fixed broadband | 37.5 | 38.4 | 38.6 | 38.8 |
| DSL, including hybrid connections | 24.7 | 24.5 | 23.6 | 22.7 |
| HFC cable | 8.7 | 8.6 | 8.5 | 8.5 |
| FTTH and FTTB | 3.4 | 4.3 | 5.3 | 6.4 |
| Stationary wireless | 0.7 | 0.9 | 0.9 | 0.8 |
| Other technologies | 0.1 | 0.1 | 0.3 | 0.3 |
Source: Bundesnetzagentur, Jahresbericht Telekommunikation 2025, pp. 10–11. Totals and components are independently rounded. The statistical broadband threshold is at least 144 kbit/s; the total is not a count of gigabit services. Stationary wireless has been included in this connection series since 2022.
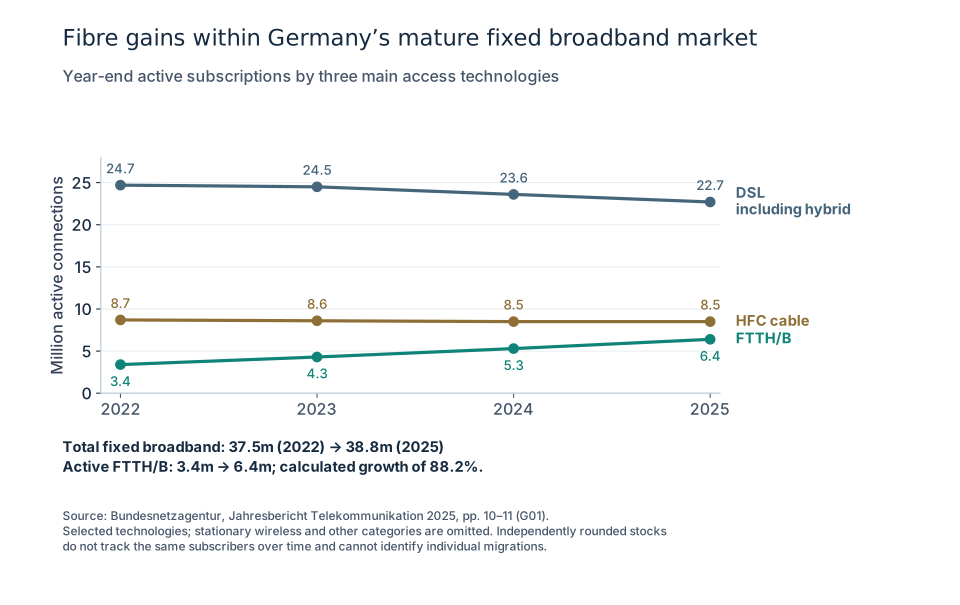
Figure 1. Germany active fixed broadband technologies, 2022–2025
Figure 1. The fixed-technology history figure compares the three principal technologies across 2022–2025. Separate aggregate paths do not identify individual subscriber migrations. Source: Bundesnetzagentur, pp. 10–11.
Open full-size figure (SVG) · Download source observations (CSV) · Original edition figure (SVG)
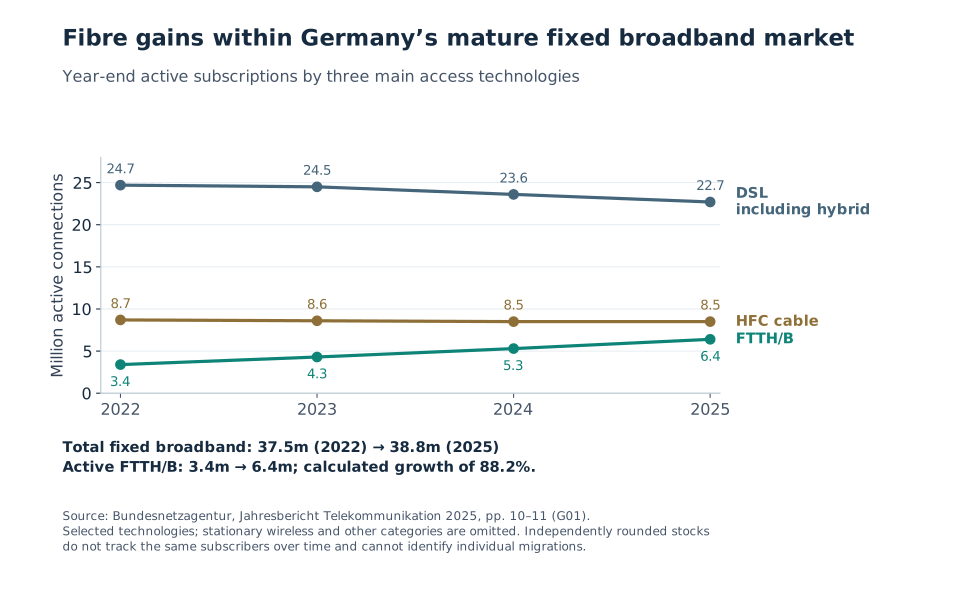
Scroll horizontally when needed, or open the full-size figure. The source observations are available as CSV.
Fibre’s calculated share of active fixed connections rose from 9.1% to 16.5%. That is a substantial change in the installed technology mix, but DSL and cable still account for most subscriptions. Existing connections consequently remain part of the economic case for fibre: the supplier must persuade a customer to switch, manage the installation and maintain a service proposition that justifies the move.
Aggregate technology changes cannot identify individual migrations. The fall in DSL and rise in fibre are consistent with substitution, but the table does not link a discontinued DSL line to a particular new fibre connection. Nor does a subscription count reveal the number of people using the service. Household size, multiple premises and business lines prevent a direct translation into population penetration.
Fibre take-up depends on the denominator
The regulator distinguishes three deployment stages. Homes passed records the reported reach of deployment. Connected includes active and inactive fibre connections installed to the relevant building or home. Active records connections in use. FTTH reaches the home; FTTB reaches the building. Combining them is useful for the national deployment account, but it does not make their final indoor infrastructure identical.
| Fibre stage, million | 2022 | 2023 | 2024 | 2025 |
|---|---|---|---|---|
| Reported homes passed | 13.1 | 17.9 | 21.8 | 27.1 |
| Connected, active and inactive | 6.4 | 7.3 | 8.6 | 10.4 |
| Active FTTH/B | 3.4 | 4.3 | 5.3 | 6.4 |
| Active ÷ connected, calculated | 53.1% | 58.9% | 61.6% | 61.5% |
| Connected ÷ passed, calculated | 48.9% | 40.8% | 39.4% | 38.4% |
| Active ÷ passed, calculated | 26.0% | 24.0% | 24.3% | 23.6% |
Source observations: Bundesnetzagentur, Jahresbericht Telekommunikation 2025, pp. 17–19. Ratios are original calculations from rounded aggregate stocks. The 2025 homes-passed definition was clarified and harmonised; implementation was incomplete, and some double counting remains possible. Passed ratios and changes therefore require particular caution.
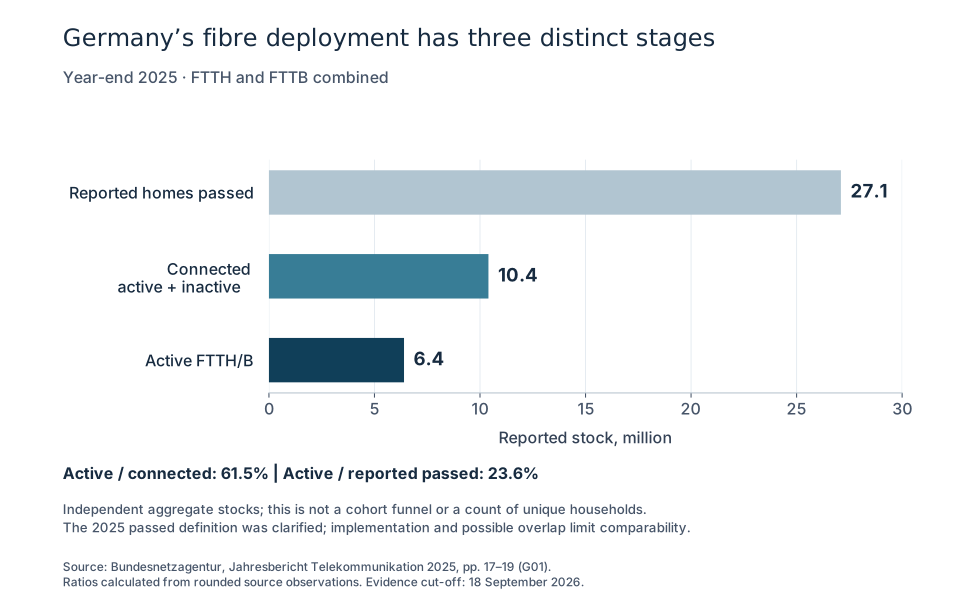
Figure 2. Germany fibre deployment stages, 2025
Figure 2. The 2025 fibre-stage figure displays the three reported stocks and their two active-connection ratios. It preserves the homes-passed definition qualification and does not present the stocks as a tracked household cohort. Source: Bundesnetzagentur, pp. 17–19.
Open full-size figure (SVG) · Download source observations (CSV) · Original edition figure (SVG)
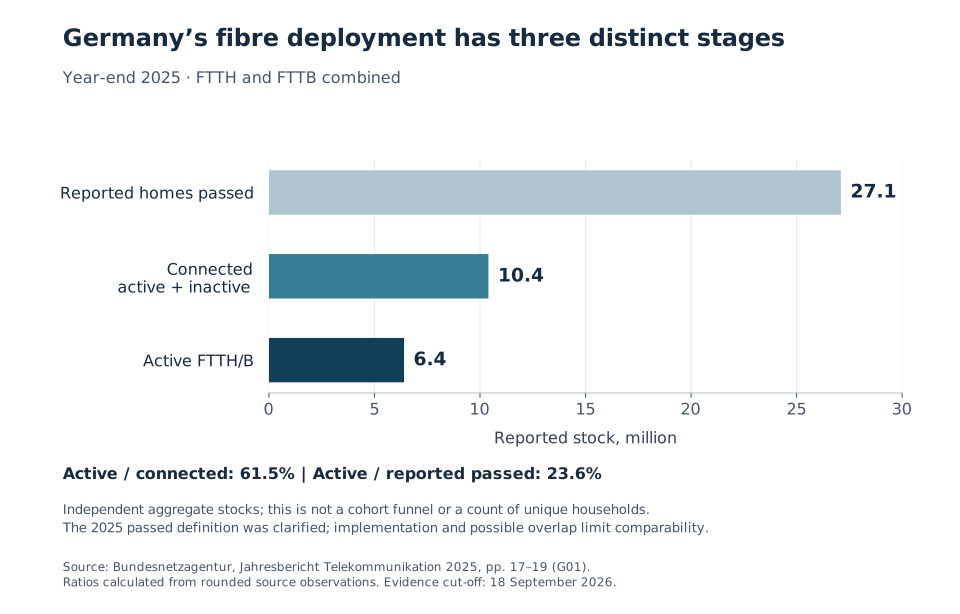
Scroll horizontally when needed, or open the full-size figure. The source observations are available as CSV.
The relationship can be written as:
Active / passed = (connected / passed) × (active / connected).
For 2025, 38.4% multiplied by 61.5% gives approximately 23.6%, subject to rounding. This identity explains why a headline take-up ratio can stay close to 24% while a considerably larger proportion of installed connections is active. It separates the completion of the connection from its use. It does not establish a causal sequence for an individual premises.
The 2025 arithmetic differences are 16.7 million between passed and connected and 4.0 million between connected and active. These quantities should not be labelled respectively as households awaiting an installer and households refusing fibre. The aggregates do not identify unique premises consistently enough, the same cohorts are not followed over time, and customer reasons are unobserved. A connection may also be reported before commercial readiness, while overlapping networks can complicate the relationship between infrastructure counts and unique addresses.
The active-to-connected ratio improved between 2022 and 2024, then was effectively unchanged in 2025 at the precision of the underlying data. That is more informative than describing fibre adoption as uniformly stagnant. Equally, the apparent decline in connected-to-passed does not prove worsening installation performance: rapid expansion of a younger deployment stock and the changed definition can affect the ratio.
A simple sensitivity illustrates the commercial scale without pretending to forecast it. Holding the 2025 connected stock fixed at 10.4 million, a five-percentage-point increase in the active-to-connected ratio corresponds to 520,000 additional active connections. Whether that is achievable, how long it would take and what it would cost require cohort-level order, installation and churn data. Those inputs are absent from this national audit.
The practical reporting improvement is to disclose these stages together, with address definitions, deployment vintage and time from order to activation. A passed-only target rewards geographic expansion; an active-only target can obscure the future pipeline. The bridge makes both visible.
Traffic growth needs a consistent boundary
| Reported traffic measure | 2022 | 2023 | 2024 | 2025 |
|---|---|---|---|---|
| Fixed broadband traffic, billion GB | 121 | 132 | 149 | 175 |
| Fixed monthly GB per connection | 274 | 293 | 322 | 376 |
| Mobile traffic, million GB | 6,714 | 9,118 | 9,592 | 10,860 |
| Mobile monthly GB per active SIM | 5.3 | 7.2 | 7.4 | 8.4 |
Source: Bundesnetzagentur, Jahresbericht Telekommunikation 2025, pp. 21 and 27. Fixed traffic includes stationary wireless from 2024 and closed-network IPTV from 2025. Mobile traffic excludes stationary wireless from the end of 2024. The table preserves the latest inspected historical vintage; it is not a fully comparable growth series.
The observations show the scale of traffic handled, but they cannot isolate the change in customer demand from changes in reporting coverage. In particular, dividing 175 by 149 and describing the result as pure fixed-network usage growth would ignore the addition of IPTV. Historical releases also carry revisions: using one inspected vintage avoids joining inconsistent published averages.
Traffic is not capacity utilisation. The audit has no matched series for peak-hour load, provisioned capacity, congestion or route-specific performance. Monthly averages also smooth the periods when households experience poor service. Capacity planning therefore needs evidence at a different resolution from national annual traffic totals.
Mobile denominators require similar care. The regulator reports 106.4 million active non-M2M SIMs in 2025, compared with 109.2 million in 2024, while machine-to-machine SIMs reached 86.1 million. Activity refers to recent communication or billing; SIMs are not people. Moreover, 1&1’s completed migration into the network-operator classification changes the MNO/MVNO split. It should not be read as a sudden shift in consumer choice or as evidence that independent retail competition disappeared. Bundesnetzagentur, Jahresbericht Telekommunikation 2025, pp. 25–26.
Prices, living costs and a selected household bill
The macroeconomic backdrop is uneven. Between the annual averages for 2022 and 2025, Germany’s all-items consumer price index increased from 110.2 to 121.9 on a 2020 base of 100, a calculated rise of 10.6%. The communication division moved from 99.4 to 98.4, a decline of about 1.0%. The divergence suggests that aggregate communication prices did not reproduce the broader increase in household living costs. It does not demonstrate that a particular household’s broadband bill fell. The communication index covers a wider basket than one fixed tariff, while actual bills depend on contract age, equipment, bundles and promotions. Destatis, Consumer price index for Germany, annual averages, updated 10 September 2026.
A public O2 Home M DSL 100 offer inspected on 18 September 2026 illustrates why the advertised introductory payment is an incomplete budget measure. The card offered €24.99 per month for twelve months, €39.99 thereafter and a €9.99 connection fee. The product information sheet specifies a 24-month minimum term, VAT-inclusive pricing and a price excluding hardware. The following calculation assumes that the household already owns a compatible router and receives no additional mobile-bundle discount. Availability at a particular address has not been verified.
| Selected O2 service-cost calculation | Amount |
|---|---|
| First twelve months plus connection: 12 × €24.99 + €9.99 | €309.87 |
| Second twelve months of recurring service: 12 × €39.99 | €479.88 |
| Minimum-term service plus connection | €789.75 |
| Minimum-term subtotal averaged over 24 months | €32.91/month |
| Recurring price from month 13 | €39.99/month |
Sources: O2 public DSL tariff card and router FAQ and O2 Home M 100/150 product information sheet, June 2026, p. 2. The sheet’s introductory prose contains a product-name inconsistency; the title, price table and linked offer identify the selected product. Calculations exclude hardware acquisition or rental, optional services and unverified address-specific work.
The recurring monthly payment increases by about 60% when this promotion ends. That is a contract-stage change, not a forecast of market inflation. The €32.91 average is also not the monthly invoice: averaging spreads the introductory discount and connection fee across the term. Cash at activation cannot be established from the advertised prices without knowing billing timing. The calculation therefore gives a bounded service subtotal, rather than an all-in quote for every household.
Other acquisition mechanisms can make the distinction larger. Telekom’s public shop explains average-price calculations and cashback that requires a customer claim after activation and receipt of the first invoice. Such conditions create a difference between an advertised effective cost and the cash flow a household actually experiences. Telekom, internet-tariff and cashback FAQ, accessed 18 September 2026.
A complete matched provider basket was not secured for this audit. The selected example cannot identify Germany’s cheapest provider or establish typical expenditure. Nor is an income-affordability ratio reported: a compatible household disposable-income denominator, distribution and household type would be needed. Aggregate price indices and a selected bill illuminate different parts of the question; neither resolves the burden on low-income households.
Participation is broader than deployment
Germany’s household ICT survey reports that 95% of people aged 16–74 used the internet within the previous three months in 2025. Within that population, the share was 98% among those aged 25–44 and 87% among those aged 65–74, an eleven-percentage-point gap. The corresponding ever-used-internet shares were 99% and 90%. Destatis, Internet users and online shoppers 2025 by age and sex, table updated 27 November 2025.
These results separate participation from physical reach. An available connection cannot by itself guarantee use, and a person can use the internet without subscribing to fibre at home. The survey also excludes people aged 75 and above from these figures. It would therefore be misleading to describe 95% as the share of Germany’s entire population using the internet.
For acquisition and support, the age difference makes an assisted route relevant: customers may need help comparing contracts, arranging installation, configuring equipment and resolving faults. That is a reason to test assisted provision, rather than proof that age causes non-use or that assistance alone will close the gap. This audit lacks matched data on income, disability, rural location and household connection technology. It cannot allocate non-use among affordability, skills, preference and unavailable infrastructure.
Competition is experienced at an address
National scale remains consequential, but national shares are a poor proxy for the alternatives available to a particular household. Deutsche Telekom held 38.8% of direct retail broadband connections in 2025. In the fibre deployment account, the three largest providers represented 51% of active connections, 43% of connected premises and 59% of homes passed. These are different competitive positions at different stages; the operators responsible for the largest future footprint are not necessarily those with the same share of today’s active base. Bundesnetzagentur, Jahresbericht Telekommunikation 2025, pp. 12 and 19–20.
The regulator’s February 2026 provisional market analysis illustrates the geographic issue. It identified sufficiently developed competition in Munich, Cologne, Ingolstadt and Wolfsburg to propose withdrawing ex ante regulation there, while reaching a different conclusion for Segeberg despite Telekom’s relatively small share. Fragmented alternative footprints did not provide the same local infrastructure choice. This is a dated provisional finding, not a claim about a final legal determination as of this audit’s cut-off. Bundesnetzagentur, provisional broadband market findings, 25 February 2026.
A useful competitive comparison consequently needs three layers: the retail brands a customer can buy, the networks those brands use, and the independently controlled infrastructure available at the address. Several offers over the same underlying network can create retail rivalry without providing independent physical resilience. Conversely, a provider can market service through wholesale access beyond the network it owns.
That distinction also applies to mobile. Retail brands, MNO accounting categories and use of another operator’s radio network are separate facts. Vodafone’s fiscal 2026 reporting attributes part of its German mobile revenue development to wholesale use by 1&1 customers. That relationship is evidence of an upstream commercial dependency; it does not mean those customers became Vodafone retail subscribers. Vodafone, FY26 Preliminary Results, 12 May 2026, p. 9.
Financial performance reveals different pressures
Germany’s regulator reports tangible telecom investment of €13.4 billion in 2022, €14.9 billion in 2023 and €15.3 billion in both 2024 and 2025; the last observation is provisional. Newly leased rights of use are excluded from that series. The investment account should therefore not be equated with a comprehensive measure of economic capital committed, nor with the cash capital expenditure of any one listed company. Bundesnetzagentur, Jahresbericht Telekommunikation 2025, pp. 8–9.
Domestic operator disclosures show why deployment totals alone cannot establish financial health.
| Domestic segment and reporting period | Revenue, €m | Service revenue, €m | Adjusted EBITDAaL, €m | Adjusted EBITDAaL margin |
|---|---|---|---|---|
| Deutsche Telekom Germany, calendar 2023 | 25,187 | 22,096 | 10,238 | 40.6% |
| Deutsche Telekom Germany, calendar 2024 | 25,711 | 22,480 | 10,516 | 40.9% |
| Deutsche Telekom Germany, calendar 2025 | 25,610 | 22,710 | 10,694 | 41.8% |
| Vodafone Germany, year ended 31 March 2025 | 12,180 | 10,876 | 4,384 | 36.0% |
| Vodafone Germany, year ended 31 March 2026 | 12,133 | 10,874 | 4,243 | 35.0% |
Sources: Deutsche Telekom, Annual Report 2025, Germany segment, key financial data; Vodafone, FY26 Preliminary Results, p. 9. These are company-defined adjusted measures for domestic segments. Different fiscal periods, activities and adjustments prevent a clean relative-efficiency ranking; the values are not summed into a national total.
Telekom’s service revenue and adjusted margin increased in 2025 despite slightly lower total revenue. Vodafone’s fiscal 2026 German service revenue was approximately stable on a reported basis, while adjusted earnings and margin declined. Vodafone reported a 0.2% organic service-revenue decline and a 3.3% organic adjusted-EBITDAaL decline. Its account attributes pressures to several factors, including the television contracting transition and competitive conditions. These company explanations should remain separate from independently identified causes.
The latest inspected Vodafone quarter adds a useful tension. In April–June 2026, German service revenue increased by 1.2% organically, while broadband customers declined by 98,000. The company linked its performance partly to pricing and wholesale or business services. Revenue improvement can therefore coexist with a shrinking broadband customer base. It would be premature to use the quarterly revenue result alone as evidence of successful mass-market retention. Vodafone, Q1 FY27 Trading Update, 27 July 2026, p. 5.
This financial section covers two substantial domestic segments, not every competitor. It does not estimate sector free cash flow, fibre unit economics, debt capacity or investment returns. A construction programme can be commercially promising while still failing a financing test at a particular provider; that test requires information beyond aggregate deployment and adjusted operating earnings.
Installation, wholesale access and support connect the market
A broadband sale passes through several distinct relationships: the customer chooses a retail offer; the provider verifies address eligibility and underlying network access; any required physical connection and equipment are installed; billing and discounts begin; support then has to resolve failures across these layers. This process map explains where the fibre denominator bridge becomes operational. Moving from passed to connected requires a different intervention from converting an installed connection into a paying subscription.
The public offer evidence is useful here because it records customer-facing conditions. O2 permits customers to use their own compatible router and advertises installation support. Those provisions can alter equipment expenditure and the support route, but they do not establish that every address can be activated immediately or that every building-work charge is zero. Telekom’s cashback conditions add a post-activation administrative step. O2 DSL and router FAQ; Telekom internet-tariff FAQ.
Upstream dependencies persist after installation. Vodafone’s April–June 2026 update describes marketing fibre outside its cable footprint through partnerships. At the internet interconnection layer, Bundesnetzagentur’s 2025/2026 net-neutrality report records its examination of complaints concerning interconnection and possible effects on end users. An investigation is not a finding of infringement or proof of market-wide congestion. Together, these sources show why the retail provider, physical access network and onward connectivity should be recorded separately when analysing service delivery. Vodafone, Q1 FY27 Trading Update, p. 5; Bundesnetzagentur, Net Neutrality in Germany 2025/2026, paragraphs 14–15.
No national series of order-to-activation time, failed installations or support resolution was established in this audit. Those are priority operational measures for testing the explanation, rather than unobserved weaknesses to assume.
Service quality and regulation
Deployment policy provides direction, while contractual delivery determines the service experienced. The European Commission’s updated account of Germany’s strategy describes the ambition for fibre and the latest mobile technology wherever people live, work and travel by 2030. This is a policy target, not an observation that those services are already universally available. European Commission, Digital connectivity in Germany, updated 5 March 2026.
Measured speed evidence has a narrower population. Bundesnetzagentur’s 2025/2026 net-neutrality report records 184,452 valid fixed-line tests for October 2024–September 2025. In this voluntary sample, 45.9% reached at least the contractual maximum and 85.9% reached at least half of it. The findings concern participating tests and their contracts. They do not imply that the remaining share of all German households experienced an equivalent shortfall. Selection into testing, test conditions and contract mix limit generalisation. Bundesnetzagentur, Net Neutrality in Germany 2025/2026, paragraphs 64–66.
For market analysis, the useful distinction is between advertised access speed, observed delivery and the processes through which customers can seek remedy. A gigabit-capable footprint is not the same measure as a gigabit subscription or a gigabit result in a household test. Fibre activation, service quality and consumer confidence should therefore be monitored together, while respecting the limits of each source.
The next twelve months: observable tests
The most defensible outlook is conditional. Fibre should be assessed through the relationship between additional passed, connected and active stocks, with particular attention to any further definition changes. The next regulator release can strengthen the activation interpretation if active-to-connected improves on a compatible basis. A rising stock of installed but inactive connections would instead direct attention towards customer conversion, product fit and the timing of newly completed deployment. Neither outcome alone would identify the cause.
Operator results provide a second test. Service-revenue improvement accompanied by more stable broadband customer numbers and sustained domestic earnings would support a stronger commercial interpretation than price-led revenue growth alongside continuing losses. Fiscal periods must remain separate. The next Vodafone release should be read against its April–June 2026 combination of organic service growth and subscriber contraction; Telekom’s domestic series provides another company trajectory, not a control group.
A third test is whether regional access arrangements translate into verifiable customer alternatives. Subsequent market-analysis decisions, wholesale offers and address-level availability can clarify the implications of the February 2026 provisional findings. National concentration ratios alone cannot answer that question.
The following critical success factors state what would have to work and what evidence could weaken the proposition.
| Critical success factor | Evidence supporting its relevance | Observable indicator | What would weaken the proposition |
|---|---|---|---|
| Turn completed fibre connections into sustained service use | Deployment-stage bridge; existing DSL/cable alternatives | Active-to-connected ratio, plus deployment-cohort activation and churn where disclosed | More inactive installed stock with no cohort-adjusted activation improvement; gains explained by reclassification |
| Retain customers while improving service economics | Domestic earnings and customer paths; introductory-price mechanics | Domestic service revenue, adjusted earnings, broadband net changes and comparable minimum-term bills | Revenue improvement dependent on price rises while losses accelerate and earnings fail to improve |
| Preserve meaningful local access choices | Regional competition assessment; wholesale and roaming dependencies | Address-level network alternatives, wholesale availability and actual installation eligibility | Additional retail brands share one physical option, or advertised offers cannot be ordered locally |
| Make installation and support usable across customer groups | Participation gap; installation/router terms; measured service experience | Activation time, failed-installation rate, support resolution and participation by age/income | More deployment without improved delivery measures or a narrowing participation gap on comparable data |
These are evaluation criteria, not numerical forecasts or guarantees. Several require new disclosures. Their absence should reduce confidence in the relevant explanation, rather than be filled with assumed values.
Conclusion
Germany’s telecom transition is best understood as the commercial and operational conversion of new infrastructure within an already large connected market. Fibre has gained active share rapidly, but the national deployment account contains more than one kind of unfinished work. The distinction between passing a premises, completing its connection and activating a service is therefore central to a credible assessment.
The denominator bridge gives a reusable way to examine that transition. Its value comes from retaining the definitions: 61.5% active-to-connected and 23.6% active-to-passed describe different relationships within the same 2025 account. Neither is a complete diagnosis of demand. Company finances, local alternatives, household contract costs and service delivery supply the surrounding evidence needed to interpret them.
Methods, data and limitations
This audit applies Market Audit Series methods version 1.1.0. It is a structured synthesis of public primary sources with original descriptive calculations. It is not based on interviews, a commissioned household survey, transaction-level tariffs or a causal identification strategy.
The observation file records source identifiers, periods, units, geographic or company scope, denominators and source locators. Calculations use the published rounded observations and retain formulas. Annual history is taken from the latest inspected regulator vintage. Provisional investment figures remain labelled; operator fiscal years and company-defined adjusted measures remain separate. The analysis neither reconstructs individual fibre deployment cohorts nor matches subscriber migrations across technologies.
The homes-passed definition change, possible overlap, traffic-series coverage breaks and mobile classification changes are material constraints. National shares cannot establish address-level competition. Voluntary speed tests cannot establish population-wide service failure. The selected tariff requires address verification and excludes equipment expenditure under an explicit own-router assumption. No complete provider basket, household affordability distribution, or sector-wide financing model is asserted.
The reusable contribution consists of the fibre-stage observations and arithmetic bridge, accompanied by the wider market observations, tariff calculation and evidence map. Original sources retain their own rights and definitions; linked reports and source graphics are not republished as though they were the author’s data collection. Corrections should identify the affected observation, its source vintage and any dependent calculations so that the narrative and downloadable data can be updated together.
Funding and conflicts of interest
Funding: No report-specific funding declaration is recorded.
Competing interests: No report-specific declaration is recorded.
Data availability
Download the observations (CSV), calculation record (JSON) and source register (JSON). Corrections can be submitted through the correction form.
Methodology and evidence coverage
Market boundary
Germany on the national regulator, domestic company-segment and specified resident-survey bases.
Included activities
- Retail connectivity acquisition, installation, use and retention
- Supporting wholesale access and roaming relationships
- Dated conditional prices and domestic commercial outcomes
Excluded activities
- Separate wholesale-market valuation
- Unallocated national revenue or earnings aggregation
Changes in this edition
- First Germany methodology1.1 audit with source-linked2022–2025 history and separately dated2026 context.
- Original fibre denominator bridge and conditional tariff calculations preserve definition, fiscal and sampling limits.
Earlier publication dates and correction notices remain part of this work's history.
Key indicators and their sources
- Germany — FTTH/B active
- 3,400,000 active broadband connections 2022-01-01 to 2022-12-31 · observation · not-stated No extra confidence interval or measurement accuracy inferred from the published rounded value. Jahresbericht Telekommunikation 2025 · p.19 fibre stages table
- Germany — FTTH/B connected active+inactive
- 6,400,000 reported connected premises 2022-01-01 to 2022-12-31 · observation · not-stated No extra confidence interval or measurement accuracy inferred from the published rounded value. Jahresbericht Telekommunikation 2025 · p.19 fibre stages table
- Germany — FTTH/B homes passed
- 13,100,000 reported homes or premises passed 2022-01-01 to 2022-12-31 · observation · not-stated No extra confidence interval or measurement accuracy inferred from the published rounded value. Jahresbericht Telekommunikation 2025 · p.19 fibre stages table
- Germany — FTTH/B active
- 4,300,000 active broadband connections 2023-01-01 to 2023-12-31 · observation · not-stated No extra confidence interval or measurement accuracy inferred from the published rounded value. Jahresbericht Telekommunikation 2025 · p.19 fibre stages table
- Germany — FTTH/B connected active+inactive
- 7,300,000 reported connected premises 2023-01-01 to 2023-12-31 · observation · not-stated No extra confidence interval or measurement accuracy inferred from the published rounded value. Jahresbericht Telekommunikation 2025 · p.19 fibre stages table
- Germany — FTTH/B homes passed
- 17,900,000 reported homes or premises passed 2023-01-01 to 2023-12-31 · observation · not-stated No extra confidence interval or measurement accuracy inferred from the published rounded value. Jahresbericht Telekommunikation 2025 · p.19 fibre stages table
- Germany — FTTH/B active
- 5,300,000 active broadband connections 2024-01-01 to 2024-12-31 · observation · not-stated No extra confidence interval or measurement accuracy inferred from the published rounded value. Jahresbericht Telekommunikation 2025 · p.19 fibre stages table
- Germany — FTTH/B connected active+inactive
- 8,600,000 reported connected premises 2024-01-01 to 2024-12-31 · observation · not-stated No extra confidence interval or measurement accuracy inferred from the published rounded value. Jahresbericht Telekommunikation 2025 · p.19 fibre stages table
- Germany — FTTH/B homes passed
- 21,800,000 reported homes or premises passed 2024-01-01 to 2024-12-31 · observation · not-stated No extra confidence interval or measurement accuracy inferred from the published rounded value. Jahresbericht Telekommunikation 2025 · p.19 fibre stages table
- Germany — FTTH/B active
- 6,400,000 active broadband connections 2025-01-01 to 2025-12-31 · observation · not-stated No extra confidence interval or measurement accuracy inferred from the published rounded value. Jahresbericht Telekommunikation 2025 · p.19 fibre stages table
- Germany — FTTH/B connected active+inactive
- 10,400,000 reported connected premises 2025-01-01 to 2025-12-31 · observation · not-stated No extra confidence interval or measurement accuracy inferred from the published rounded value. Jahresbericht Telekommunikation 2025 · p.19 fibre stages table
- Germany — FTTH/B homes passed
- 27,100,000 reported homes or premises passed 2025-01-01 to 2025-12-31 · observation · not-stated No extra confidence interval or measurement accuracy inferred from the published rounded value. Jahresbericht Telekommunikation 2025 · p.19 fibre stages table
- Germany — Active fixed broadband
- 37,500,000 active broadband connections 2022-01-01 to 2022-12-31 · observation · not-stated No extra confidence interval or measurement accuracy inferred from the published rounded value. Jahresbericht Telekommunikation 2025 · pp.10–11 active broadband chart
- Germany — DSL including hybrid
- 24,700,000 active broadband connections 2022-01-01 to 2022-12-31 · observation · not-stated No extra confidence interval or measurement accuracy inferred from the published rounded value. Jahresbericht Telekommunikation 2025 · pp.10–11 active broadband chart
- Germany — HFC cable
- 8,700,000 active broadband connections 2022-01-01 to 2022-12-31 · observation · not-stated No extra confidence interval or measurement accuracy inferred from the published rounded value. Jahresbericht Telekommunikation 2025 · pp.10–11 active broadband chart
- Germany — Stationary wireless
- 700,000 active broadband connections 2022-01-01 to 2022-12-31 · observation · not-stated No extra confidence interval or measurement accuracy inferred from the published rounded value. Jahresbericht Telekommunikation 2025 · pp.10–11 active broadband chart
- Germany — Leased lines radio satellite and other
- 100,000 active broadband connections 2022-01-01 to 2022-12-31 · observation · not-stated No extra confidence interval or measurement accuracy inferred from the published rounded value. Jahresbericht Telekommunikation 2025 · pp.10–11 active broadband chart
- Germany — Tangible investment
- 13,400,000,000 EUR 2022-01-01 to 2022-12-31 · observation · not-stated No extra confidence interval or measurement accuracy inferred from the published rounded value. Jahresbericht Telekommunikation 2025 · pp.8–9 investment chart
- Germany — Deutsche Telekom direct retail broadband share
- 39.1 percent 2022-01-01 to 2022-12-31 · observation · not-stated No extra confidence interval or measurement accuracy inferred from the published rounded value. Jahresbericht Telekommunikation 2025 · p.12 retail market share
- Germany — Active fixed broadband
- 38,400,000 active broadband connections 2023-01-01 to 2023-12-31 · observation · not-stated No extra confidence interval or measurement accuracy inferred from the published rounded value. Jahresbericht Telekommunikation 2025 · pp.10–11 active broadband chart
- Germany — DSL including hybrid
- 24,500,000 active broadband connections 2023-01-01 to 2023-12-31 · observation · not-stated No extra confidence interval or measurement accuracy inferred from the published rounded value. Jahresbericht Telekommunikation 2025 · pp.10–11 active broadband chart
- Germany — HFC cable
- 8,600,000 active broadband connections 2023-01-01 to 2023-12-31 · observation · not-stated No extra confidence interval or measurement accuracy inferred from the published rounded value. Jahresbericht Telekommunikation 2025 · pp.10–11 active broadband chart
- Germany — Stationary wireless
- 900,000 active broadband connections 2023-01-01 to 2023-12-31 · observation · not-stated No extra confidence interval or measurement accuracy inferred from the published rounded value. Jahresbericht Telekommunikation 2025 · pp.10–11 active broadband chart
- Germany — Leased lines radio satellite and other
- 100,000 active broadband connections 2023-01-01 to 2023-12-31 · observation · not-stated No extra confidence interval or measurement accuracy inferred from the published rounded value. Jahresbericht Telekommunikation 2025 · pp.10–11 active broadband chart
- Germany — Tangible investment
- 14,900,000,000 EUR 2023-01-01 to 2023-12-31 · observation · not-stated No extra confidence interval or measurement accuracy inferred from the published rounded value. Jahresbericht Telekommunikation 2025 · pp.8–9 investment chart
- Germany — Deutsche Telekom direct retail broadband share
- 39 percent 2023-01-01 to 2023-12-31 · observation · not-stated No extra confidence interval or measurement accuracy inferred from the published rounded value. Jahresbericht Telekommunikation 2025 · p.12 retail market share
- Germany — Active fixed broadband
- 38,600,000 active broadband connections 2024-01-01 to 2024-12-31 · observation · not-stated No extra confidence interval or measurement accuracy inferred from the published rounded value. Jahresbericht Telekommunikation 2025 · pp.10–11 active broadband chart
- Germany — DSL including hybrid
- 23,600,000 active broadband connections 2024-01-01 to 2024-12-31 · observation · not-stated No extra confidence interval or measurement accuracy inferred from the published rounded value. Jahresbericht Telekommunikation 2025 · pp.10–11 active broadband chart
- Germany — HFC cable
- 8,500,000 active broadband connections 2024-01-01 to 2024-12-31 · observation · not-stated No extra confidence interval or measurement accuracy inferred from the published rounded value. Jahresbericht Telekommunikation 2025 · pp.10–11 active broadband chart
- Germany — Stationary wireless
- 900,000 active broadband connections 2024-01-01 to 2024-12-31 · observation · not-stated No extra confidence interval or measurement accuracy inferred from the published rounded value. Jahresbericht Telekommunikation 2025 · pp.10–11 active broadband chart
- Germany — Leased lines radio satellite and other
- 300,000 active broadband connections 2024-01-01 to 2024-12-31 · observation · not-stated No extra confidence interval or measurement accuracy inferred from the published rounded value. Jahresbericht Telekommunikation 2025 · pp.10–11 active broadband chart
- Germany — Tangible investment
- 15,300,000,000 EUR 2024-01-01 to 2024-12-31 · observation · not-stated No extra confidence interval or measurement accuracy inferred from the published rounded value. Jahresbericht Telekommunikation 2025 · pp.8–9 investment chart
- Germany — Deutsche Telekom direct retail broadband share
- 39.1 percent 2024-01-01 to 2024-12-31 · observation · not-stated No extra confidence interval or measurement accuracy inferred from the published rounded value. Jahresbericht Telekommunikation 2025 · p.12 retail market share
- Germany — Active fixed broadband
- 38,800,000 active broadband connections 2025-01-01 to 2025-12-31 · observation · not-stated No extra confidence interval or measurement accuracy inferred from the published rounded value. Jahresbericht Telekommunikation 2025 · pp.10–11 active broadband chart
- Germany — DSL including hybrid
- 22,700,000 active broadband connections 2025-01-01 to 2025-12-31 · observation · not-stated No extra confidence interval or measurement accuracy inferred from the published rounded value. Jahresbericht Telekommunikation 2025 · pp.10–11 active broadband chart
- Germany — HFC cable
- 8,500,000 active broadband connections 2025-01-01 to 2025-12-31 · observation · not-stated No extra confidence interval or measurement accuracy inferred from the published rounded value. Jahresbericht Telekommunikation 2025 · pp.10–11 active broadband chart
- Germany — Stationary wireless
- 800,000 active broadband connections 2025-01-01 to 2025-12-31 · observation · not-stated No extra confidence interval or measurement accuracy inferred from the published rounded value. Jahresbericht Telekommunikation 2025 · pp.10–11 active broadband chart
- Germany — Leased lines radio satellite and other
- 300,000 active broadband connections 2025-01-01 to 2025-12-31 · observation · not-stated No extra confidence interval or measurement accuracy inferred from the published rounded value. Jahresbericht Telekommunikation 2025 · pp.10–11 active broadband chart
- Germany — Tangible investment
- 15,300,000,000 EUR 2025-01-01 to 2025-12-31 · forecast · preliminary No extra confidence interval or measurement accuracy inferred from the published rounded value. Jahresbericht Telekommunikation 2025 · pp.8–9 investment chart
- Germany — Deutsche Telekom direct retail broadband share
- 38.8 percent 2025-01-01 to 2025-12-31 · observation · not-stated No extra confidence interval or measurement accuracy inferred from the published rounded value. Jahresbericht Telekommunikation 2025 · p.12 retail market share
- Germany — Fixed broadband data traffic
- 121,000,000,000 GB 2022-01-01 to 2022-12-31 · observation · not-stated No extra confidence interval or measurement accuracy inferred from the published rounded value. Jahresbericht Telekommunikation 2025 · p.21 traffic chart
- Germany — Mobile data traffic
- 6,714,000,000 GB 2022-01-01 to 2022-12-31 · observation · not-stated No extra confidence interval or measurement accuracy inferred from the published rounded value. Jahresbericht Telekommunikation 2025 · p.27 traffic chart
- Germany — Monthly data per fixed broadband connection
- 274 GB 2022-01-01 to 2022-12-31 · observation · not-stated No extra confidence interval or measurement accuracy inferred from the published rounded value. Jahresbericht Telekommunikation 2025 · p.21 traffic chart
- Germany — Monthly data per active SIM
- 5.3 GB 2022-01-01 to 2022-12-31 · observation · not-stated No extra confidence interval or measurement accuracy inferred from the published rounded value. Jahresbericht Telekommunikation 2025 · p.27 traffic chart
- Germany — Fixed broadband data traffic
- 132,000,000,000 GB 2023-01-01 to 2023-12-31 · observation · not-stated No extra confidence interval or measurement accuracy inferred from the published rounded value. Jahresbericht Telekommunikation 2025 · p.21 traffic chart
- Germany — Mobile data traffic
- 9,118,000,000 GB 2023-01-01 to 2023-12-31 · observation · not-stated No extra confidence interval or measurement accuracy inferred from the published rounded value. Jahresbericht Telekommunikation 2025 · p.27 traffic chart
- Germany — Monthly data per fixed broadband connection
- 293 GB 2023-01-01 to 2023-12-31 · observation · not-stated No extra confidence interval or measurement accuracy inferred from the published rounded value. Jahresbericht Telekommunikation 2025 · p.21 traffic chart
- Germany — Monthly data per active SIM
- 7.2 GB 2023-01-01 to 2023-12-31 · observation · not-stated No extra confidence interval or measurement accuracy inferred from the published rounded value. Jahresbericht Telekommunikation 2025 · p.27 traffic chart
- Germany — Fixed broadband data traffic
- 149,000,000,000 GB 2024-01-01 to 2024-12-31 · observation · not-stated No extra confidence interval or measurement accuracy inferred from the published rounded value. Jahresbericht Telekommunikation 2025 · p.21 traffic chart
- Germany — Mobile data traffic
- 9,592,000,000 GB 2024-01-01 to 2024-12-31 · observation · not-stated No extra confidence interval or measurement accuracy inferred from the published rounded value. Jahresbericht Telekommunikation 2025 · p.27 traffic chart
- Germany — Monthly data per fixed broadband connection
- 322 GB 2024-01-01 to 2024-12-31 · observation · not-stated No extra confidence interval or measurement accuracy inferred from the published rounded value. Jahresbericht Telekommunikation 2025 · p.21 traffic chart
- Germany — Monthly data per active SIM
- 7.4 GB 2024-01-01 to 2024-12-31 · observation · not-stated No extra confidence interval or measurement accuracy inferred from the published rounded value. Jahresbericht Telekommunikation 2025 · p.27 traffic chart
- Germany — Fixed broadband data traffic
- 175,000,000,000 GB 2025-01-01 to 2025-12-31 · observation · not-stated No extra confidence interval or measurement accuracy inferred from the published rounded value. Jahresbericht Telekommunikation 2025 · p.21 traffic chart
- Germany — Mobile data traffic
- 10,860,000,000 GB 2025-01-01 to 2025-12-31 · observation · not-stated No extra confidence interval or measurement accuracy inferred from the published rounded value. Jahresbericht Telekommunikation 2025 · p.27 traffic chart
- Germany — Monthly data per fixed broadband connection
- 376 GB 2025-01-01 to 2025-12-31 · observation · not-stated No extra confidence interval or measurement accuracy inferred from the published rounded value. Jahresbericht Telekommunikation 2025 · p.21 traffic chart
- Germany — Monthly data per active SIM
- 8.4 GB 2025-01-01 to 2025-12-31 · observation · not-stated No extra confidence interval or measurement accuracy inferred from the published rounded value. Jahresbericht Telekommunikation 2025 · p.27 traffic chart
- Germany — Active SIM excluding M2M
- 105,500,000 SIM cards 2023-01-01 to 2023-12-31 · observation · not-stated No extra confidence interval or measurement accuracy inferred from the published rounded value. Jahresbericht Telekommunikation 2025 · pp.25–26 active SIM table
- Germany — MNO-classified active SIM
- 81,000,000 SIM cards 2023-01-01 to 2023-12-31 · observation · not-stated No extra confidence interval or measurement accuracy inferred from the published rounded value. Jahresbericht Telekommunikation 2025 · p.26 active SIM table
- Germany — M2M SIM
- 62,800,000 SIM cards 2023-01-01 to 2023-12-31 · observation · not-stated No extra confidence interval or measurement accuracy inferred from the published rounded value. Jahresbericht Telekommunikation 2025 · p.26 active SIM table
- Germany — 5G NSA active SIM
- 19,700,000 SIM cards 2023-01-01 to 2023-12-31 · observation · not-stated No extra confidence interval or measurement accuracy inferred from the published rounded value. Jahresbericht Telekommunikation 2025 · p.26 active SIM table
- Germany — Active SIM excluding M2M
- 109,200,000 SIM cards 2024-01-01 to 2024-12-31 · observation · not-stated No extra confidence interval or measurement accuracy inferred from the published rounded value. Jahresbericht Telekommunikation 2025 · pp.25–26 active SIM table
- Germany — MNO-classified active SIM
- 86,600,000 SIM cards 2024-01-01 to 2024-12-31 · observation · not-stated No extra confidence interval or measurement accuracy inferred from the published rounded value. Jahresbericht Telekommunikation 2025 · p.26 active SIM table
- Germany — M2M SIM
- 73,700,000 SIM cards 2024-01-01 to 2024-12-31 · observation · not-stated No extra confidence interval or measurement accuracy inferred from the published rounded value. Jahresbericht Telekommunikation 2025 · p.26 active SIM table
- Germany — 5G NSA active SIM
- 37,400,000 SIM cards 2024-01-01 to 2024-12-31 · observation · not-stated No extra confidence interval or measurement accuracy inferred from the published rounded value. Jahresbericht Telekommunikation 2025 · p.26 active SIM table
- Germany — Active SIM excluding M2M
- 106,400,000 SIM cards 2025-01-01 to 2025-12-31 · observation · not-stated No extra confidence interval or measurement accuracy inferred from the published rounded value. Jahresbericht Telekommunikation 2025 · pp.25–26 active SIM table
- Germany — MNO-classified active SIM
- 95,500,000 SIM cards 2025-01-01 to 2025-12-31 · observation · not-stated No extra confidence interval or measurement accuracy inferred from the published rounded value. Jahresbericht Telekommunikation 2025 · p.26 active SIM table
- Germany — M2M SIM
- 86,100,000 SIM cards 2025-01-01 to 2025-12-31 · observation · not-stated No extra confidence interval or measurement accuracy inferred from the published rounded value. Jahresbericht Telekommunikation 2025 · p.26 active SIM table
- Germany — 5G NSA active SIM
- 57,900,000 SIM cards 2025-01-01 to 2025-12-31 · observation · not-stated No extra confidence interval or measurement accuracy inferred from the published rounded value. Jahresbericht Telekommunikation 2025 · p.26 active SIM table
- Germany — FTTH active
- 5,200,000 active broadband connections 2025-01-01 to 2025-12-31 · observation · not-stated No extra confidence interval or measurement accuracy inferred from the published rounded value. Jahresbericht Telekommunikation 2025 · p.18 fibre table
- Germany — FTTB active
- 1,200,000 active broadband connections 2025-01-01 to 2025-12-31 · observation · not-stated No extra confidence interval or measurement accuracy inferred from the published rounded value. Jahresbericht Telekommunikation 2025 · p.18 fibre table
- Germany — FTTH connected
- 7,100,000 reported connected premises 2025-01-01 to 2025-12-31 · observation · not-stated No extra confidence interval or measurement accuracy inferred from the published rounded value. Jahresbericht Telekommunikation 2025 · p.18 fibre table
- Germany — FTTB connected
- 3,300,000 reported connected premises 2025-01-01 to 2025-12-31 · observation · not-stated No extra confidence interval or measurement accuracy inferred from the published rounded value. Jahresbericht Telekommunikation 2025 · p.18 fibre table
- Germany — Satellite broadband
- 175,000 active broadband connections 2025-01-01 to 2025-12-31 · observation · not-stated No extra confidence interval or measurement accuracy inferred from the published rounded value. Jahresbericht Telekommunikation 2025 · p.21 satellite paragraph
- Germany — Broadband marketed at least100Mbps
- 23,600,000 active broadband connections 2025-01-01 to 2025-12-31 · observation · not-stated No extra confidence interval or measurement accuracy inferred from the published rounded value. Jahresbericht Telekommunikation 2025 · pp.11–12 speed classes
- Germany — Broadband marketed at least1Gbps
- 3,000,000 active broadband connections 2025-01-01 to 2025-12-31 · observation · not-stated No extra confidence interval or measurement accuracy inferred from the published rounded value. Jahresbericht Telekommunikation 2025 · p.12 speed classes
- Germany — Top3 provider share of fibre active
- 51 percent 2025-01-01 to 2025-12-31 · observation · not-stated No extra confidence interval or measurement accuracy inferred from the published rounded value. Jahresbericht Telekommunikation 2025 · pp.19–20 concentration discussion
- Germany — Top3 provider share of fibre connected
- 43 percent 2025-01-01 to 2025-12-31 · observation · not-stated No extra confidence interval or measurement accuracy inferred from the published rounded value. Jahresbericht Telekommunikation 2025 · pp.19–20 concentration discussion
- Germany — Top3 provider share of fibre passed
- 59 percent 2025-01-01 to 2025-12-31 · observation · not-stated No extra confidence interval or measurement accuracy inferred from the published rounded value. Jahresbericht Telekommunikation 2025 · pp.19–20 concentration discussion
Framework coverage
| Module | Coverage | Evidence limitation |
|---|---|---|
| E0 · Identity, decision use and market boundary | complete | See the module analysis. |
| E1 · Market baseline and development | partial | No matched cohort, causal model or representative local outcomes establish the wider mechanism. |
| E2 · Macroenvironment | partial | No compatible household disposable-income distribution. One complete bounded tariff example, not 3-provider matched basket. |
| E3 · Policy, regulation and stakeholders | partial | No finalSeptember 2026 legal determination established. No full spectrum/subsidy inventory. |
| E4 · Industry structure and economics | partial | Two domestic segments, not all-firm finance. No matched free-cash-flow, debt or fibre-unit economics. |
| E5 · Customers, segments and demand | partial | Survey excludes 75+. No joined income/rural/disability/connection-technology data. |
| E6 · Routes to market, suppliers and partners | partial | No national activation-time, failed-installation or support-ticket series. |
| E7 · Competition, alternatives and positioning | partial | No address-level provider-choice sample. |
| E8 · Innovation, technology and transition | partial | No cohort tracking, capacity-utilisation or causal demand estimate. |
| E9 · Outlook, uncertainty and scenarios | complete | See the module analysis. |
| E10 · Opportunities, threats and critical success factors | complete | See the module analysis. |
| E11 · Limitations, monitoring and review | complete | See the module analysis. |
Material evidence limitations
- Unique-household fibre coverage, conversion probabilities or causal refusal counts inferred from stage stocks; Unchanged-definition homes-passed growth across the 2025 clarification or clean traffic growth across 2024–2025 scope changes
- Unchanged-definition homes-passed growth across the 2025 clarification or clean traffic growth across 2024–2025 scope changes
- Causal subscriber migration or switching inferred from aggregate technology paths or changing SIM classifications
- National affordability, cheapest-provider rankings or address-verified all-in bills from a single conditional advertised basket
- Time-matched cross-company efficiency ranking or national revenue/earnings sum from differing domestic segments and fiscal periods
- Whole-population participation or national service-failure rates inferred from ages16–74 or voluntary speed-test users
- Whole-population participation or national service-failure rates inferred from ages16–74 or voluntary speed-test users
- National shares or retail brands interpreted as independently controlled orderable networks at an address
- A final September2026 legal determination, exhaustive legal-compliance advice or universal coverage inferred from provisional findings or policy targets
- Representative installation failures, supplier costs or support outcomes from public service descriptions
- Numerical forecasts, measured causal CSF weights or realised return on investment
Conclusions this evidence cannot support
- Unique-household fibre coverage, conversion probabilities or causal refusal counts inferred from stage stocks
- Unchanged-definition homes-passed growth across the 2025 clarification or clean traffic growth across 2024–2025 scope changes
- Causal subscriber migration or switching inferred from aggregate technology paths or changing SIM classifications
- National affordability, cheapest-provider rankings or address-verified all-in bills from a single conditional advertised basket
- Time-matched cross-company efficiency ranking or national revenue/earnings sum from differing domestic segments and fiscal periods
- Whole-population participation or national service-failure rates inferred from ages16–74 or voluntary speed-test users
- National shares or retail brands interpreted as independently controlled orderable networks at an address
- A final September2026 legal determination, exhaustive legal-compliance advice or universal coverage inferred from provisional findings or policy targets
- Representative installation failures, supplier costs or support outcomes from public service descriptions
- Numerical forecasts, measured causal CSF weights or realised return on investment
References
Numbered references correspond to the PDF edition. Descriptive links in the article identify the sources used for individual claims.
- Bundesnetzagentur. 2026-06-05. Jahresbericht Telekommunikation 2025. Printed pp. 5–12, 17–21, 25–27; p.19 fibre stages table. Source G01. Accessed 2026-09-18.
- Bundesnetzagentur. 2026-06-05. Annual Report Telecommunications 2025: fibre-optic rollout progressing. Fibre connections, investment and data use sections. Source G02. Accessed 2026-09-18.
- Bundesnetzagentur. 2026-02-25. Bundesnetzagentur identifies first effective competition in the broadband mass market in four cities. Provisional findings, four cities and Segeberg paragraphs. Source G03. Accessed 2026-09-18.
- Bundesnetzagentur. Net Neutrality in Germany Annual Report 2025/2026. Paragraphs14–15,41–50,64–66; printed pp.8,16–18,21–22. Source G04. Accessed 2026-09-18. Publication date not established.
- Deutsche Telekom. Annual Report 2025: Germany operating segment. Key financial data; Customer development tables, columns2025/2024/2023. Source G05. Accessed 2026-09-18. Publication date not established.
- Vodafone Group Plc. 2026-05-12. FY26 Preliminary Results. Printed p.9 Germany: financial table, Growth and Customers. Source G06. Accessed 2026-09-18.
- Vodafone Group Plc. 2026-07-27. Q1 FY27 Trading Update. Printed p.5 Germany: financial table, Customers, Operational actions. Source G07. Accessed 2026-09-18.
- Statistisches Bundesamt (Destatis). 2026-09-10. Consumer price index for Germany: twelve divisions. Annual average; total/divisions1–4 and5–8;2020=100. Source G08. Accessed 2026-09-18.
- Statistisches Bundesamt (Destatis). 2025-11-27. Internet users and online shoppers 2025 by age and sex. Total table and age rows; Internet users together / including past three months. Source G09. Accessed 2026-09-18.
- Telefónica Germany/O2. DSL tariffs: O2 Home M100 and router FAQ. Home M100 tariff card; router-choice and installation FAQ. Source G10. Accessed 2026-09-18. Publication date not established.
- Telefónica Germany/O2. 2026-06. Produktinformationsblatt O2 Home M100/150. p.2 Entgelt für das Komplettprodukt(Listenpreis) inkl.MwSt.; Vertragslaufzeiten. Source G11. Accessed 2026-09-18.
- Telekom Deutschland. Internet tariffs: average price and cashback FAQ. Average-price calculation, cashback registration and address availability FAQ. Source G12. Accessed 2026-09-18. Publication date not established.
- European Commission. 2026-03-05. Digital connectivity in Germany. National strategy and Gigabit Strategy2022 sections. Source G13. Accessed 2026-09-18.