report
US Telecommunications: Broadband Competition and Household Access
US broadband competition, fixed–mobile convergence and household costs, with company comparisons, participation evidence and dated offers.
- Status
- Published
- Published
- Reviewed
- Publisher
- Research Mind
- Author
- Topics
- United States telecommunications · broadband competition · fixed wireless access · fibre broadband · household affordability · digital participation · convergence
Cite this work
Reference tools
How to cite this work
Choose a referencing style, copy the formatted reference, or download citation data for a reference manager.
Citation target. This reference points to the stable arachchi.ge work record.
Selected style APA 7
Arachchige, K. L. (2026). US Telecommunications: Broadband Competition and Household Access. Research Mind. https://www.arachchi.ge/works/united-states-telecommunications-industry/
APA 7 is shown by default. The citation files below remain available when interactive controls are unavailable.
Download citation data
Arachchige, K. L. (2026). US Telecommunications: Broadband Competition and Household Access. Research Mind. https://www.arachchi.ge/works/united-states-telecommunications-industry/
Arachchige, K.L. (2026) US Telecommunications: Broadband Competition and Household Access. Research Mind. Available at: https://www.arachchi.ge/works/united-states-telecommunications-industry/.
Arachchige, Kushan Liyana. 2026. US Telecommunications: Broadband Competition and Household Access. Research Mind. https://www.arachchi.ge/works/united-states-telecommunications-industry/.
Arachchige, Kushan Liyana. US Telecommunications: Broadband Competition and Household Access. Research Mind, 18 Sept. 2026, https://www.arachchi.ge/works/united-states-telecommunications-industry/.
[1] K. L. Arachchige, “US Telecommunications: Broadband Competition and Household Access,” Research Mind, Sep. 2026. [Online]. Available: https://www.arachchi.ge/works/united-states-telecommunications-industry/
1. Arachchige KL. US Telecommunications: Broadband Competition and Household Access [Internet]. Research Mind; 2026 Sep. Available from: https://www.arachchi.ge/works/united-states-telecommunications-industry/
Abstract
Fibre and fixed wireless growth coexist with declining broadband subscriptions at two large United States cable operators, while mobile service expansion cushions their revenue losses unevenly. In the second quarter of 2026, the year-on-year mobile service revenue gain offset 90.2% of Charter’s residential internet revenue decline and 33.9% of Comcast’s domestic residential broadband decline. These descriptive decompositions do not establish the profitability of bundling or identify household switching paths. A separate stock-flow reconciliation shows why acquisitions also matter: AT&T’s consumer fibre base increased by 1.738 million in the first half of 2026, compared with 617,000 reported net additions, alongside a disclosed acquired customer base. The audit connects these supplier trajectories with household participation evidence and dated retail offers. Recent adult survey results show a substantial income gradient in smartphone dependence, while advertised prices vary with promotional periods, payment methods, equipment and associated mobile service. The analysis uses inspected primary company disclosures through June 2026, an extended quarterly fibre sequence, distinct household and adult survey periods, and public offers captured on 18 September 2026. Its contribution is a reproducible comparison that preserves customer definitions, acquisition adjustments and unresolved billing conditions. The findings support four priorities: retain customer value across services, make lifecycle prices usable, align capacity with reliable substitution and measure participation separately from provider growth. Observable conditions guide the next 12–24 months; national shares and causal displacement remain outside the evidence.
Scholarly PDF
Download scholarly PDF · v1.0Cite this version when referring to the PDF. Check this article for corrections and later editions.
Research status
Evidence checked through . Methodology 1.1.0 · Coverage and limitations · Edition record.
On this page
E0. Market boundary: household connectivity, with company scope preserved
This audit studies the supply and purchase of internet connectivity in the United States, concentrating on fixed broadband and its interaction with mobile subscriptions. Fibre, cable and fixed wireless belong in the same household decision because each may provide a primary home connection. A mobile phone subscription may complement or sometimes replace that connection, but a mobile line is not a household. Business connections enter only where a provider’s published category includes them and the table says so.
The unit of competition is ultimately an eligible service address and a usable offer. National provider names do not establish that a household has several alternatives. Similarly, an additional subscription can represent switching, an additional residence, a business connection or a second service; it need not represent a newly connected household. The selected company panel therefore supports comparisons of reported commercial trajectories, not estimates of national penetration or market share.
Three boundaries govern the evidence. Company operational stocks and flows retain their original customer definitions. Financial analysis uses identified domestic service categories rather than adding group revenues with international or media businesses. Household and adult surveys supply participation context, with their populations and dates kept separate. The primary company records are AT&T’s schedule (S02), Charter’s results (S03) and Comcast’s domestic tables (S04).
E1. Market base: divergent trajectories and an acquisition break
At June 2026, the panel contains growing fibre and fixed wireless bases alongside declining cable broadband counts. The rows below are intentionally not summed: some include business connections, while others cover residential customers only.
| Provider and reported category | June 2026 stock, thousands | Q2 2026 net additions, thousands | Scope |
|---|---|---|---|
| AT&T total fibre | 12,868 | 367 | Consumer and business |
| AT&T total fixed wireless | 2,611 | 279 | Consumer and business |
| Charter internet | 29,388 | -172 | Residential and small business |
| Charter residential internet | 27,358 | -166 | Residential subset of preceding row |
| Comcast domestic residential broadband | 28,486 | -167 | Residential |
Sources: AT&T S02, printed p. 8; Charter S03, Key Operating Results; Comcast S04, customer metrics. Stocks are end-quarter; net additions are quarter flows. The Charter subset must not be added to its total.
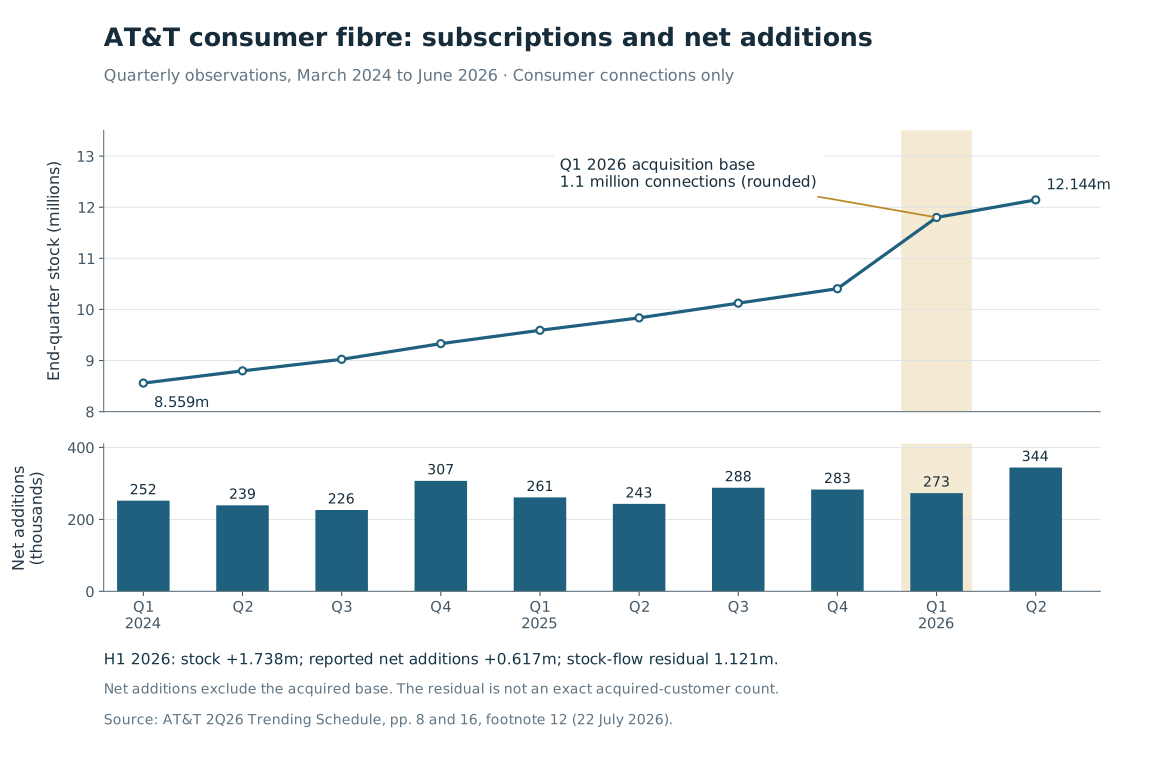
A longer consumer-only fibre series demonstrates why a single year-on-year growth rate is insufficient.
| Quarter | AT&T consumer fibre stock, thousands | Reported quarterly net additions, thousands |
|---|---|---|
| 2024 Q1 | 8,559 | 252 |
| 2024 Q2 | 8,798 | 239 |
| 2024 Q3 | 9,024 | 226 |
| 2024 Q4 | 9,331 | 307 |
| 2025 Q1 | 9,592 | 261 |
| 2025 Q2 | 9,835 | 243 |
| 2025 Q3 | 10,123 | 288 |
| 2025 Q4 | 10,406 | 283 |
| 2026 Q1 | 11,800 | 273 |
| 2026 Q2 | 12,144 | 344 |
Source: AT&T S02, printed pp. 8 and 16, footnote 12.
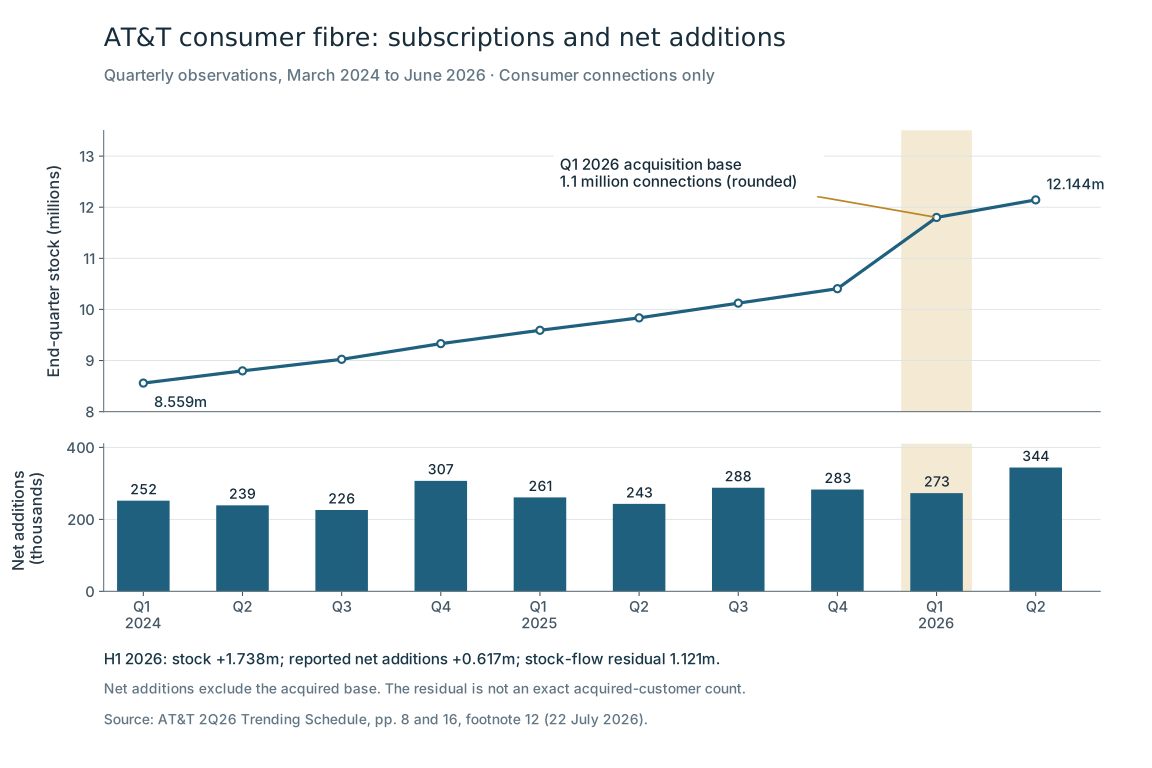
Figure 1. AT&T consumer fibre subscriptions and net additions
Figure 1. The consumer fibre stock and net-additions figure shows the quarterly path and marks the acquisition-related break in the stock series. Source: AT&T trending schedule, pp. 8 and 16.
Open full-size figure (SVG) · Download source observations (CSV) · Original edition figure (SVG)
Scroll horizontally when needed, or open the full-size figure. The source observations are available as CSV.
Calculated from this series, 2025 consumer fibre growth was 11.5%, or 1.075 million net additions. During the first half of 2026, the stock rose by 1.738 million but reported net additions totalled 617,000. The 1.121 million residual is a stock-flow reconciliation item, not a precise acquired-customer estimate. AT&T separately disclosed a rounded 1.1 million Lumen fibre acquisition base adjustment. Treating the entire stock rise as customer acquisition through ordinary sales would materially overstate operating momentum.
The counterevidence is that consumer fibre net additions remained positive in every displayed quarter, including after the acquisition. The acquisition changes the scale of reported growth; it does not explain away the underlying positive flow. Conversely, this panel cannot establish how much fibre or fixed wireless growth came directly from cable customers. That requires switching or address-level evidence.
E2. Household costs: a headline price is a conditional subtotal
The macro environment gives mixed signals. August 2026 consumer prices were 3.4% above a year earlier, with electricity up 3.8%; July real disposable personal income increased 0.4% month-on-month. These observations describe household budget context after the company reporting quarter. They are not explanations of Q2 subscription changes. BLS S10, August CPI release; BEA S11, July income release.
The following calculations use public offers inspected on 18 September 2026, without supplying a test address. They illustrate billing structure across technologies; they do not rank equivalent services or claim nationwide availability.
| Selected offer | Recurring price used | First-year recurring + identified connection subtotal | What the subtotal means |
|---|---|---|---|
| AT&T Fiber 300 | $60 - $15 promotion - $10 eligible AutoPay/paperless = $35/month | $420 | Twelve recurring payments; new-customer promotion; unresolved taxes and connection charges excluded |
| AT&T Fiber 1 Gig | $90 - $30 promotion - $10 eligible AutoPay/paperless = $50/month | $600 | Same calculation basis; different speed tier |
| Spectrum Internet 500 with Advanced WiFi | $40 + $10/month | $600 | First-year offer; modem included; optional managed WiFi selected; unresolved installation/taxes excluded |
| T-Mobile Rely, regular AutoPay rate | $50/month plus $35 device connection | $635 | Recurring and connection charges; account-dependent provider fees and taxes unresolved; qualifying AutoPay assumed throughout |
| T-Mobile Rely with qualifying voice line | $35/month plus $35 device connection | $455 | Incremental internet cost only; existing qualifying voice bill excluded |
Sources: AT&T S12, offer cards and footnotes; Spectrum S13, plan and WiFi terms; T-Mobile S14, Rely and connection-charge terms. Calculations are 12 times the stated monthly charge, plus an identified one-time charge. Unknown charges are unresolved, not zero. T-Mobile account-dependent provider fees and local taxes are excluded from these subtotals. Conditional reward cards are excluded. T-Mobile notes that AutoPay may not appear on the first bill, so its subtotals assume a full year of qualifying discounts rather than a guaranteed first invoice sequence.
The actionable distinction is between the cost to start service, the recurring first-year cost and the price after the promotion. A household can face different constraints at each stage. The paired T-Mobile rows also show why a discounted bundle cannot be compared with standalone internet without retaining the associated voice bill. Spectrum’s selected WiFi option adds $120 over a year; a household supplying an appropriate router would face a different basket. These are transparent scenarios, not observed average expenditure.
E3. Institutions: transparency helps only when the offer remains legible
The FCC’s December 2022 broadband-label rule supplies a useful institutional benchmark: its pricing provisions distinguish standalone price, introductory and subsequent rates, billing discounts, recurring charges and one-time fees. This audit uses that adopted framework to organise the cost comparison; it does not claim to reproduce every subsequent rule change or the present status of every programme named in the original rule. FCC/Federal Register S15, paragraphs 13–22.
The economic mechanism is reduced search cost. A household can compare offers more reliably when discounts and connection costs are separated from the service price. Disclosure alone, however, cannot create an eligible alternative at an address or make an unaffordable payment manageable. Public national advertising also does not exhaust eligible offers: T-Mobile describes a $15 monthly home-internet option for qualifying New York customers. It is a state-specific offer, not a national tariff or a claim that all applicants qualify. T-Mobile S17, New York eligibility FAQ.
Acquisition accounting creates a parallel transparency issue for industry analysis. A change in reported customer scale may reflect a transfer of ownership rather than new capacity or household adoption. Competition assessments should therefore date ownership changes, separate inherited bases from operating additions and avoid treating an announced transaction as completed. This audit makes no national concentration estimate.
E4. Earnings: mobile growth cushions broadband pressure unevenly
A direct revenue decomposition is more informative than comparing total corporate growth. The domestic residential categories below isolate the fixed–mobile relationship, while retaining each company’s reporting definitions.
| Quarterly service revenue, $ million | Q2 2025 | Q2 2026 | Calculated change |
|---|---|---|---|
| Charter residential internet | 5,969 | 5,776 | -193 |
| Charter residential mobile service | 921 | 1,095 | +174 |
| Comcast domestic residential broadband | 6,649 | 6,280 | -369 |
| Comcast domestic wireless service | 882 | 1,007 | +125 |
Sources: Charter S03, residential revenue table; Comcast S04, Residential Connectivity & Platforms table.
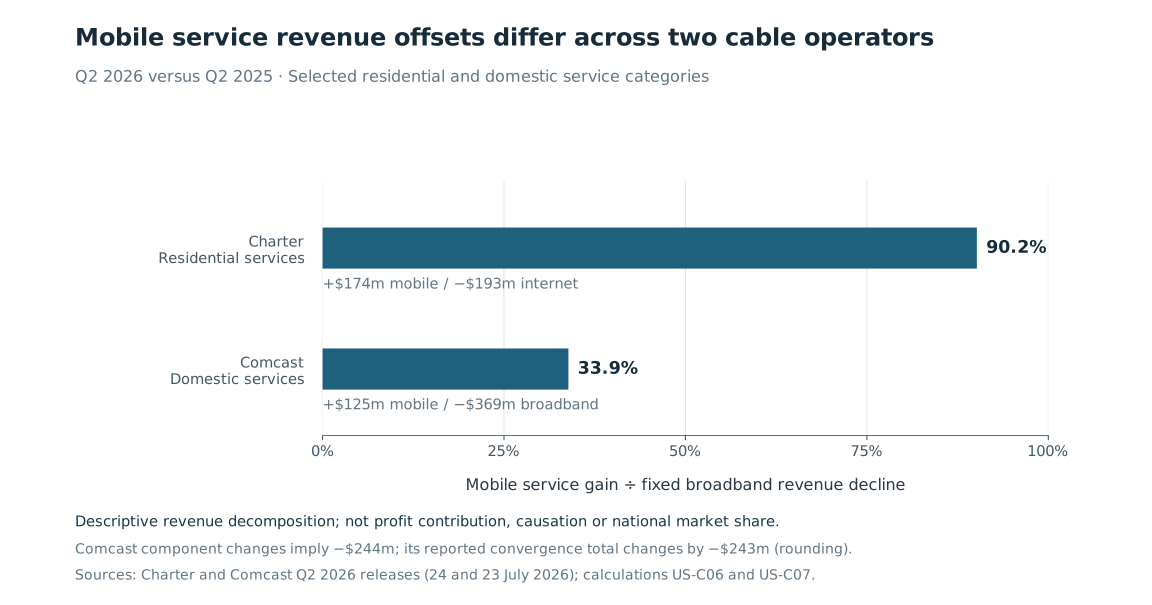
The ratio of mobile service revenue gain to fixed broadband revenue decline is 90.2% for Charter and 33.9% for Comcast. This is an original arithmetic decomposition, not an estimate of mobile profitability or the causal effect of bundling. Charter’s two components decline by $19 million in combination. Comcast’s rounded components imply a $244 million decline, while its reported convergence total declines by $243 million; the $1 million discrepancy is retained as a source-rounding difference.
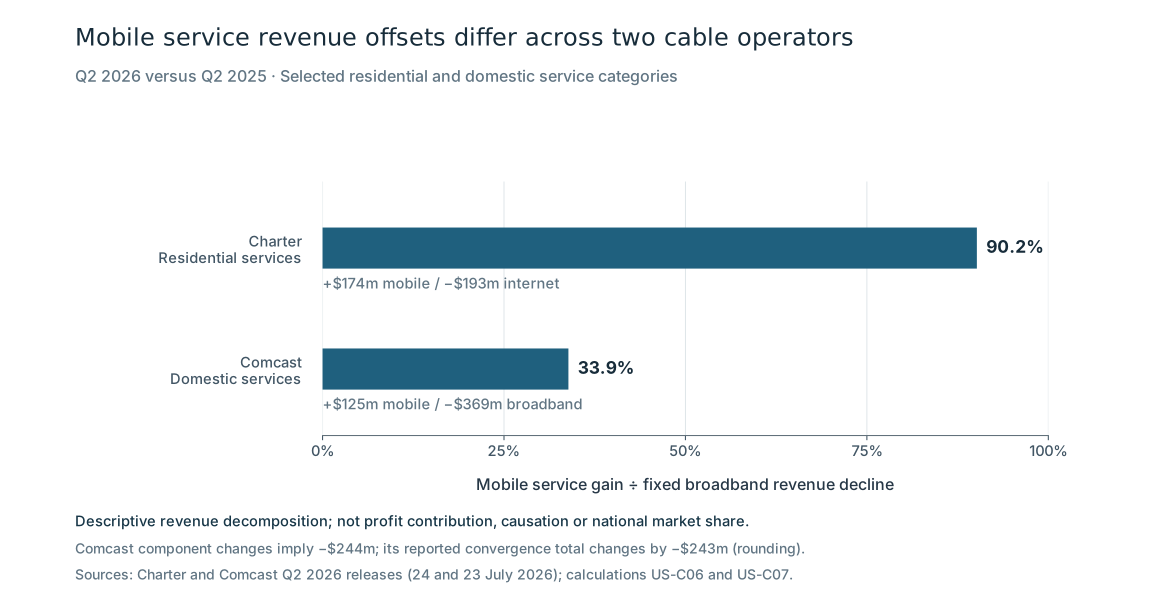
Figure 2. Mobile revenue offsets against fixed broadband declines
Figure 2. The cable-provider revenue-offset figure compares the two calculated offsets without treating revenue as profit or attributing the changes to bundling. Sources: Charter Q2 2026 and Comcast Q2 2026.
Open full-size figure (SVG) · Download source observations (CSV) · Original edition figure (SVG)
Scroll horizontally when needed, or open the full-size figure. The source observations are available as CSV.
The strategic implication is conditional. Adding mobile revenue can protect a customer relationship, but a growing line count alone does not establish that a convergence strategy has preserved revenue, margin or cash generation. Retention discounts, wholesale network costs, device costs and customer-service expenses matter to that test; comparable incremental margins were not established here.
Investment mix also matters. Charter’s upgrade/rebuild capital expenditure rose from $457 million to $657 million while total capital expenditure was broadly flat at approximately $2.87 billion. The calculated category increase is 43.8%. A stable headline investment budget can therefore conceal substantial reprioritisation. Charter S03, Capital Expenditures.
E5. Participation: high connectivity averages conceal different usable access
Census QuickFacts reports that 91.0% of households had a broadband subscription and 95.5% had a computer in the 2020–2024 five-year ACS estimate. These are pooled period measures, not observations of September 2026. The broad broadband category must not be read as fibre or cable adoption, and device ownership does not measure whether a household has enough suitable devices for its activities. Census S07, Computer and Internet Use.
More recent primary survey evidence uses a different denominator. Pew’s 2025 NPORS surveyed 5,022 adults between 5 February and 18 June through web, mail and telephone, with population weighting. It reports 78% subscribing to home broadband. Smartphone dependence was 34% among adults in households earning below $30,000 and 4% among those earning at least $100,000: a calculated 30-percentage-point difference between published estimates. The audit does not test statistical significance or infer an income effect from that association. Pew S09, methodology and income table.
Historical Census evidence adds a dimension not captured by price alone: in 2021, broadband subscription was reported for 84% of households including a person with a disability, versus 92% of households without one. Those figures are context, not a current gap estimate. Census S08, printed p. 6.
The commercial and participation questions consequently differ. Winning an already connected household can raise a provider’s subscriptions without reducing exclusion. Conversely, effective entry-level service may improve participation without maximising speed-tier revenue. Suitable devices, usable interfaces and support deserve separate measurement. The available surveys identify where to investigate those constraints; they do not establish which intervention will work or how many subscriptions it will generate.
E6. Delivery: eligibility, activation and support shape the effective market
The customer journey links an advertised offer to an actual connection: address eligibility, plan selection, payment requirements, installation or gateway setup, in-home performance and continuing support. Failure at any stage can make a nominal alternative unusable. The cost basket shows payment and equipment conditions; it does not measure completion rates at those stages.
T-Mobile’s FAQ explicitly ties unlimited home-internet eligibility to the service address and network capacity, which can change as customers join. It also distinguishes provider fibre delivered through fibre partners from its fixed wireless service and describes a gateway-return requirement after cancellation. These are concrete examples of a supplier and service chain that extends beyond the retail brand. T-Mobile S17, eligibility, fibre and cancellation sections.
The operating question is how many eligible enquiries become working, retained connections at acceptable support cost. Address approval and the advertised price precede that outcome; gateway setup, in-home performance and help with faults determine whether the connection remains useful. Network passings alone cannot measure this conversion from infrastructure to sustained service.
E7. Competition: substitution is conditional and convergence works in both directions
The selected evidence supports a narrower and more useful conclusion than a national winner ranking. Fibre and fixed wireless are credible sources of additional home connections, while cable operators can expand in mobile. In Q2 2026 Charter added 406,000 mobile lines and Comcast 448,000 domestic wireless lines even as their broadband counts fell. Mobile lines and broadband customers cannot be netted against each other to produce a household-growth figure. Charter S03; Comcast S04.
T-Mobile’s latest inspected year-end disclosure provides historical scale: 8.5 million 5G broadband customers at December 2025, with 495,000 quarterly additions; it also separately identifies 141,000 acquired 5G broadband customers in Q3 2025. Its Q2 2026 headline addition of 277,000 refers to postpaid accounts, not home-broadband customers. T-Mobile S06, year-end results; T-Mobile S05, Q2 results.
Substitution should be tested on four conditions: eligibility at the same address, adequate performance for the household’s workload, a complete lifecycle bill and manageable switching costs. A service can pass one condition and fail another. This framework also makes the competition claim falsifiable: if households cannot order an alternative, or its performance and total cost do not meet their needs, national subscription growth does not establish effective local rivalry. No representative address panel was assembled here.
E8. Technology: advertised speed does not settle service equivalence
The price table deliberately retains different technologies and speed tiers. T-Mobile describes Rely’s typical download range as 170–354 Mbps and upload range as 12–55 Mbps, with performance depending on local conditions. Its terms also identify lower priority during congestion and further deprioritisation above 1.2 TB per month; that threshold is not presented as a hard data allowance. T-Mobile S14, Rely speed and network-management terms.
Those terms matter to substitution because a household’s constraint may be upload performance, simultaneous use or reliability rather than the maximum advertised download speed. The correct comparative question is whether the service meets a defined task at the times it is needed. A national average, a top-tier headline and a typical range answer different questions.
Cable also remains an evolving technology in this comparison. Charter states a 2027 target for completing its network evolution towards symmetrical and multigigabit services. That is a company target, not evidence that every current location already receives those capabilities. Charter S03, network evolution discussion. The observed spending shift in E4 makes the upgrade programme economically material, while completion, orderability and realised customer experience remain separate tests.
E9. Outlook: three observable paths through September 2028
The next 12–24 months should be assessed through repeated observations rather than a single market-growth forecast. The scenarios below are analytical possibilities, with no assigned probabilities.
| Path | Evidence that would support it | Evidence that would weaken it |
|---|---|---|
| Convergence stabilises customer economics | Mobile revenue gains and improving fixed retention persist together; combined domestic service revenue stabilises without a deteriorating cost profile | More mobile lines coexist with continuing combined revenue erosion or rising support/acquisition costs |
| Fixed wireless remains a strong local substitute | Eligible addresses remain orderable as subscriptions grow; performance and retention support sustained use | Capacity restrictions, poorer busy-period service or churn limit substitution despite attractive advertised prices |
| Fibre and cable upgrades broaden usable competition | Completed, orderable upgrades expand within the same local areas and create credible household alternatives | Reported passings or announced upgrades fail to translate into orderable, affordable service |
A practical quarterly monitor would retain the same company category definitions, separate acquisitions and track the combined revenue decomposition. A complementary household monitor would record first-year and post-promotion bills at the same addresses, including payment and equipment conditions. Changes in survey participation should be evaluated only after confirming the new sample, question wording and reference period. Improving supplier results alone would not establish broader inclusion; improving adoption alone would not establish sustainable supplier economics.
E10. Critical success factors: what would validate or overturn the strategy
The audit identifies four testable priorities. Each connects at least two evidence modules, rather than restating a generic industry aspiration.
| Critical success factor | Evidence basis | Observable indicator | Invalidating condition |
|---|---|---|---|
| Retain customer value across fixed and mobile service | E1 subscription divergence; E4 revenue decomposition; E7 convergence | Quarterly combined domestic service revenue, fixed retention and cost-to-serve on consistent definitions | Line growth persists while combined economics deteriorate, after accounting for reporting changes |
| Make the advertised offer usable throughout its lifecycle | E2 price conditions; E3 disclosure; E6 activation | Address-verified total starting cost, first-year bill, post-promotion bill and activation completion | Discount eligibility or unresolved charges systematically prevent the target household from obtaining the expected service |
| Expand capacity where it produces reliable substitution | E6 capacity-based eligibility; E8 performance terms and upgrades | Orderable-address counts paired with busy-period performance and retention, measured on a stable sample | Coverage announcements grow while usable alternatives or performance fail to improve |
| Convert connectivity into broader participation | E2 household costs; E5 income and disability evidence | Comparable participation measures by income and disability, accompanied by device and support access | Provider gains predominantly reallocate existing subscriptions while targeted participation measures show no improvement |
These indicators are a research and operating agenda, not claims that the relevant outcomes have already been measured. The first priority has a current financial baseline; the latter three require stronger address-level, service-quality and subgroup evidence before causal conclusions are justified.
E11. Assessment, method and limits
The United States evidence supports an industry assessment centred on the quality of competition and the economics of convergence. The selected providers exhibit different subscription trajectories, and the mobile revenue offset is measurable but incomplete. Household evidence shows why the resulting competitive activity cannot be treated automatically as an inclusion outcome. The analytical contribution is the connection between those three objects—provider growth, household price conditions and usable participation—while preserving their different units.
The audit uses purposive primary-source selection, not a statistically representative provider sample or a systematic literature review. Original publisher pages and tables were inspected through 18 September 2026. Company data extend through June 2026, except the expressly dated T-Mobile fixed wireless observation at December 2025. The AT&T consumer fibre sequence covers ten consecutive quarters. Census QuickFacts supplies a 2020–2024 period estimate; the 2021 Census subgroup report supplies historical context; Pew supplies separate 2025 adult-survey evidence. The inspected Census update of 6 August 2026 stated that the 2025 ACS one-year release date was still being determined. Census S16, August update.
Calculations are descriptive and reproducible: differences, ratios, stock-flow reconciliation and specified price subtotals. They are neither econometric estimates nor claims of causal switching. Published values retain source rounding. Financial categories are not harmonised beyond their stated scope, and non-GAAP measures should not be equated with accounting profit. Offer observations are public snapshots without address-level checkout, so they cannot establish a final bill, serviceability or a cheapest-provider ranking.
The principal unresolved evidence needs are a complete national supplier denominator, comparable local availability and performance, current household subgroup tables, representative installation, complaint and supplier-cost observations, and longitudinal switching and bill data. These limits preclude a national market-share table, a competition index, a national affordability rate and a causal estimate of fixed wireless displacement. The most valuable extension is an address-based panel linking orderability, actual costs, service experience and retention, followed by properly comparable household participation updates.
Funding and competing interests
Funding: No report-specific funding declaration is recorded.
Competing interests: No report-specific declaration is recorded.
Data availability and reproducibility
Download the observations (CSV), calculations (JSON) and source register (JSON). Source identifiers US-S01–US-S17 correspond to S01–S17 in the references. Observations retain periods, entities, units and locators; calculations separate inputs and outputs, preserving the acquisition and rounding differences. Original publishers retain responsibility for their reports and offers; public access does not imply an open redistribution licence. Use the correction form to report errors.
Methodology and evidence coverage
Market boundary
United States on each source’s explicitly reported domestic/household basis; no assumed harmonisation of territory coverage.
Included activities
- Retail supply, activation and continued use
- Dated advertised price conditions
- Source-reported operational and domestic service-revenue trends
Excluded activities
- National wholesale market sizing
- Foreign corporate operations as a US service total
Changes in this edition
- First international methodology1.1 audit of United States broadband competition, household participation and conditional advertised costs.
- Preserves acquisition and reporting differences with original source-linked observations and reproducible calculations.
Earlier publication dates and correction notices remain part of this work's history.
Framework coverage
| Module | Coverage | Evidence limitation |
|---|---|---|
| E0 · Identity, decision use and market boundary | complete | See the module analysis. |
| E1 · Market baseline and development | partial | A complete national supplier denominator and switching panel are unavailable. |
| E2 · Macroenvironment | partial | Matched-address all-in bills, current income distributions and causal budget effects are not observed. |
| E3 · Policy, regulation and stakeholders | partial | Latest comprehensive operative law and programme eligibility have not been established. |
| E4 · Industry structure and economics | partial | Comparable incremental margins, cost-to-serve and causal effects are unobserved. |
| E5 · Customers, segments and demand | partial | Current compatible subgroup panels and tested intervention effects are absent. |
| E6 · Routes to market, suppliers and partners | partial | Representative activation, supplier cost and support outcomes are unobserved. |
| E7 · Competition, alternatives and positioning | partial | No national market share or representative same-address competition panel is established. |
| E8 · Innovation, technology and transition | partial | Advertised/target conditions do not establish actual local performance or completed universal deployment. |
| E9 · Outlook, uncertainty and scenarios | partial | No forecast probabilities, numerical market outlook or causal scenario weights are estimated. |
| E10 · Opportunities, threats and critical success factors | partial | CSF effects, weights and provider certification are not established. |
| E11 · Limitations, monitoring and review | complete | See the module analysis. |
Material evidence limitations
- National market shares, national supplier totals or concentration indices from the selected provider panel; Unique households or persons inferred by summing customer connections, accounts or mobile lines
- Organic growth inferred from acquisition-affected stock changes
- Address-verified all-in bills, cheapest-provider rankings or national affordability rates from advertised subtotals
- A homogeneous trend from mixed household/adult populations, survey periods or source definitions
- Causal switching, income, bundling or investment effects from descriptive differences
- Measured national support quality, installation failure or busy-period performance from offer descriptions
- Numerical forecasts, probabilities or measured CSF weights
- Current comprehensive legal-compliance advice or benefit-programme eligibility conclusions
Conclusions this evidence cannot support
- National market shares, national supplier totals or concentration indices from the selected provider panel
- Unique households or persons inferred by summing customer connections, accounts or mobile lines
- Organic growth inferred from acquisition-affected stock changes
- Address-verified all-in bills, cheapest-provider rankings or national affordability rates from advertised subtotals
- Causal switching, income, bundling or investment effects from descriptive differences
- A homogeneous trend from mixed household/adult populations, survey periods or source definitions
- Measured national support quality, installation failure or busy-period performance from offer descriptions
- Numerical forecasts, probabilities or measured CSF weights
- Current comprehensive legal-compliance advice or benefit-programme eligibility conclusions
References
Numbered references correspond to the PDF edition. Descriptive links in the article identify the sources used for individual claims.
- AT&T. 2026-07-22. AT&T Delivers Strong Second-Quarter Results as Investment-Led Strategy Gains Momentum. Second-quarter highlights; segment results; footnotes on reorganisation and Lumen acquisition. Source S01. Accessed 2026-09-18.
- AT&T. 2026-07-22. 2Q26 AT&T Trending Schedule. Printed page 8: Internet operating volumes; printed page 16 footnote 12; footnotes 2–4. Source S02. Accessed 2026-09-18.
- Charter Communications. 2026-07-24. Charter Announces Second Quarter 2026 Results. Key Operating Results; Residential Revenue; unaudited financial and operating addendum; Capital Expenditures. Source S03. Accessed 2026-09-18.
- Comcast Corporation. 2026-07-23. Comcast Reports 2nd Quarter 2026 Results. Connectivity & Platforms customer metrics; Residential Connectivity & Platforms revenue table. Source S04. Accessed 2026-09-18.
- T-Mobile US. 2026-07-23. T-Mobile Delivers Continued Strong Account Growth, Translating into Industry-Leading Service Revenue Growth Driven by Widening Differentiation. Customer results; footnotes on account base adjustments. Source S05. Accessed 2026-09-18.
- T-Mobile US. 2026-02-11. T-Mobile Delivers Best-in-Class Customer Results in Q4, Translating into Durable and Profitable Financial Growth Driven By Widening Differentiation. Customer results; footnotes on UScellular and fibre acquisition bases. Source S06. Accessed 2026-09-18.
- U.S. Census Bureau. QuickFacts: United States. Families & Living Arrangements; Computer and Internet Use; Income & Poverty. Source S07. Accessed 2026-09-18. Publication date not stated.
- U.S. Census Bureau. 2024-06-18. Computer and Internet Use in the United States: 2021 (ACS-56). Computer and Internet Use by Household Income; disability section. Source S08. Accessed 2026-09-18. Author: Daniela Mejía.
- Pew Research Center. 2025-11-20. Internet, Broadband Fact Sheet. How we did this; Home broadband use; Smartphone dependency by income, 2025 row. Source S09. Accessed 2026-09-18.
- U.S. Bureau of Labor Statistics. 2026-09-11. Consumer Price Index — August 2026. USDL-26-1496; headline CPI-U and selected categories. Source S10. Accessed 2026-09-18.
- U.S. Bureau of Economic Analysis. 2026-08-26. Personal Income and Outlays, July 2026. Real disposable personal income and real PCE, monthly change table. Source S11. Accessed 2026-09-18.
- AT&T. AT&T Fiber Internet. 300Mbps and 1GIG offer cards and promotional footnotes. Source S12. Accessed 2026-09-18. Publication date not stated.
- Spectrum / Charter Communications. Spectrum Internet. 100/500/Gig plan cards; modem and Advanced WiFi terms. Source S13. Accessed 2026-09-18. Publication date not stated.
- T-Mobile US. 5G Home Internet Plans. Rely regular $50 AutoPay footnotes; $35 voice-bundle FAQ; device connection charge; speed/network-management terms. Source S14. Accessed 2026-09-18. Publication date not stated.
- Federal Communications Commission / Federal Register. 2022-12-16. Empowering Broadband Consumers Through Transparency. Final rule paragraphs13–22, pp76963–76964. Source S15. Accessed 2026-09-18.
- U.S. Census Bureau. 2026-08-06. 2026 ACS News and Updates. August6 2026 update; February17 2026 update. Source S16. Accessed 2026-09-18.
- T-Mobile US. Home Internet FAQ. New York Affordable Broadband Act eligibility FAQ; address/service terms. Source S17. Accessed 2026-09-18. Publication date not stated.