report
Fixed Broadband and Internet Use in Japan, Sri Lanka, the United States and Germany
Compare fixed broadband and internet use across four countries, with reproducible data and evidence on household participation.
Record details
- Status
- Published
- Published
- Reviewed
- Publisher
- Arachchige Publications
- Author
- Topics
- fixed broadband · internet use · digital participation · Japan telecommunications · Sri Lanka telecommunications · United States broadband · Germany telecommunications
Cite this work
Reference tools
How to cite this work
Choose a referencing style, copy the formatted reference, or download citation data for a reference manager.
Citation target. This reference points to the stable arachchi.ge work record.
Selected style APA 7
Arachchige, K. L. (2026). Fixed Broadband and Internet Use in Japan, Sri Lanka, the United States and Germany (Version 1.0). Arachchige Publications. https://www.arachchi.ge/works/fixed-broadband-internet-use-four-countries/
APA 7 is shown by default. The citation files below remain available when interactive controls are unavailable.
Download citation data
Arachchige, K. L. (2026). Fixed Broadband and Internet Use in Japan, Sri Lanka, the United States and Germany (Version 1.0). Arachchige Publications. https://www.arachchi.ge/works/fixed-broadband-internet-use-four-countries/
Arachchige, K.L. (2026) Fixed Broadband and Internet Use in Japan, Sri Lanka, the United States and Germany. Arachchige Publications. Available at: https://www.arachchi.ge/works/fixed-broadband-internet-use-four-countries/.
Arachchige, Kushan Liyana. 2026. Fixed Broadband and Internet Use in Japan, Sri Lanka, the United States and Germany. Version 1.0. Arachchige Publications. https://www.arachchi.ge/works/fixed-broadband-internet-use-four-countries/.
Arachchige, Kushan Liyana. Fixed Broadband and Internet Use in Japan, Sri Lanka, the United States and Germany. Version 1.0, Arachchige Publications, 12 Oct. 2026, https://www.arachchi.ge/works/fixed-broadband-internet-use-four-countries/.
[1] K. L. Arachchige, “Fixed Broadband and Internet Use in Japan, Sri Lanka, the United States and Germany,” Arachchige Publications, Oct. 2026. [Online]. Available: https://www.arachchi.ge/works/fixed-broadband-internet-use-four-countries/
1. Arachchige KL. Fixed Broadband and Internet Use in Japan, Sri Lanka, the United States and Germany [Internet]. Arachchige Publications; 2026 Oct. Available from: https://www.arachchi.ge/works/fixed-broadband-internet-use-four-countries/
Abstract
Fixed-broadband subscriptions and individual internet use measure different aspects of connectivity. This study follows both indicators in Japan, Sri Lanka, the United States and Germany using 128 requested country–indicator–year cells from World Bank World Development Indicators, with International Telecommunication Union attribution. The refreshed extract contains 119 nonmissing values and nine missing cells; 2021–2023 is the recent complete joint window. Japan, the United States and Germany record increases in both series, while Sri Lanka records falling fixed-subscription density alongside rising internet use. National sources qualify the interpretation. Sri Lanka's regulator reports a different subscription path and explicitly attributes a later decrease to reporting error; this prevents reading the international density decline as a measured switch to mobile internet. Its 2025 household survey also shows substantial age and residential-sector differences. Japan's household survey distinguishes whether anyone uses the internet from the connections reported by user households, with fixed and mobile categories overlapping. The contribution is a reproducible account of these separate trajectories and bounded national contrasts. Every available annual observation is retained, missing cells are explicit, and calculations use original precision rather than displayed rounded values. Different original populations, recall periods, classifications and source vintages preclude a country inclusion score or a causal explanation of subscription change.
Scholarly PDF
Download scholarly PDF · v1.0Cite this version when referring to the PDF. Check this article for corrections and later editions.
Data and figures
Data edition v1.0
International subscription and internet-use series, with separate national observations, definitions, calculations and sources.
- Download international observations (CSV)
- Sri Lanka survey observations (CSV)
- Sri Lanka subscription observations (CSV)
- Japan household observations (CSV)
- Definitions and methods (JSON)
- Calculations (JSON)
- Source register (JSON)
On this page
Fixed broadband and internet use followed different paths
Sri Lanka’s reported fixed-broadband density fell from 10.5 to 8.8 subscriptions per 100 people between 2021 and 2023, while reported internet use rose from 44.5% to 51.2%. Japan, the United States and Germany recorded increases in both measures over the same period. These paths establish that a country’s subscription density and participation measure can move differently. They do not identify who gained access, who changed connections or why either series changed.
The comparison uses the two International Telecommunication Union (ITU) indicators distributed through World Bank World Development Indicators (WDI), refreshed on 12 October 2026 from the 8 October database vintage. Every available intermediate observation is retained. The recent complete joint window ends in 2023 because Japan’s fixed-broadband value is missing for 2024; 2025 remains missing for both indicators in all four countries. A missing value is not a zero. ITU/WDI fixed broadband; ITU/WDI internet use.
| Country | Fixed subscriptions per 100 people, 2021 → 2023 | Change, subscriptions per 100 people | Internet use, 2021 → 2023 | Change, percentage points |
|---|---|---|---|---|
| Japan | 35.9 → 38.6 | +2.7 | 82.9% → 85.0% | +2.1 |
| Sri Lanka | 10.5 → 8.8 | -1.8 | 44.5% → 51.2% | +6.7 |
| United States | 37.0 → 38.1 | +1.1 | 91.3% → 93.5% | +2.3 |
| Germany | 44.1 → 45.4 | +1.3 | 91.4% → 92.5% | +1.0 |
Source: ITU via WDI, indicators IT.NET.BBND.P2 and IT.NET.USER.ZS. Changes are calculated from unrounded source values, then displayed to one decimal. The columns describe different quantities; their levels or changes cannot be subtracted from one another to measure an access gap.
Fixed subscriptions include residential and organisational connections. One household connection can support several people, and an organisation can hold several connections. Individual internet use can involve a fixed connection, mobile service or access outside the home. The WDI generic use definition refers to three months, but historical country notes include different recall periods. The international series therefore supplies source-published context without establishing identical underlying national samples. Historical ITU country notes for Japan, retained in UNdata, document twelve-month use; that older vintage does not certify the notes behind the current 2023–2024 observations. WDI fixed-broadband definition; WDI internet-use definition.
What changed within the international series?
Japan’s fixed-density series rose in both 2022 and 2023. Its internet-use increase was concentrated in 2022: reported use moved from 82.9% in 2021 to 84.9% in 2022 and 85.0% in 2023. The common direction consequently does not imply that the two quantities grew at the same pace. Germany’s and the United States’ subscription densities also rose across the two intervals, while their use measures increased by approximately one and two percentage points, respectively, over the full window.
Sri Lanka’s divergence likewise persists through the intermediate year. Fixed density moved from 10.5 in 2021 to 9.6 in 2022 and 8.8 in 2023; use moved from 44.5% to 48.3% and 51.2%. The available 2024 values continue those directions, reaching 8.5 subscriptions per 100 people and 54.6% internet use. The other available 2024 use estimates are Japan 85.5%, United States 94.7% and Germany 93.5%. These are extensions of individual series, rather than an additional complete four-country paired observation.
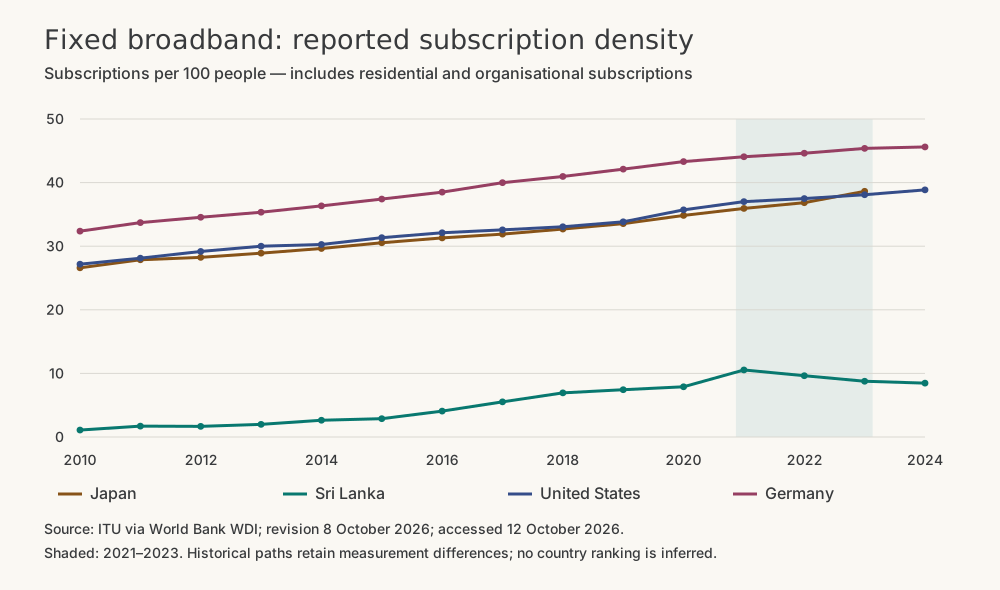
Figure 1. Fixed-broadband subscription density. The full available history supplies context; the shaded interval is the main 2021–2023 window. Subscription definitions and reporting changes require national interpretation. Figure 1: fixed-broadband subscription density · Source-linked observations.
Open full-size figure (SVG) · Download source observations (CSV)
Scroll horizontally when needed, or open the full-size figure. The source observations are available as CSV.
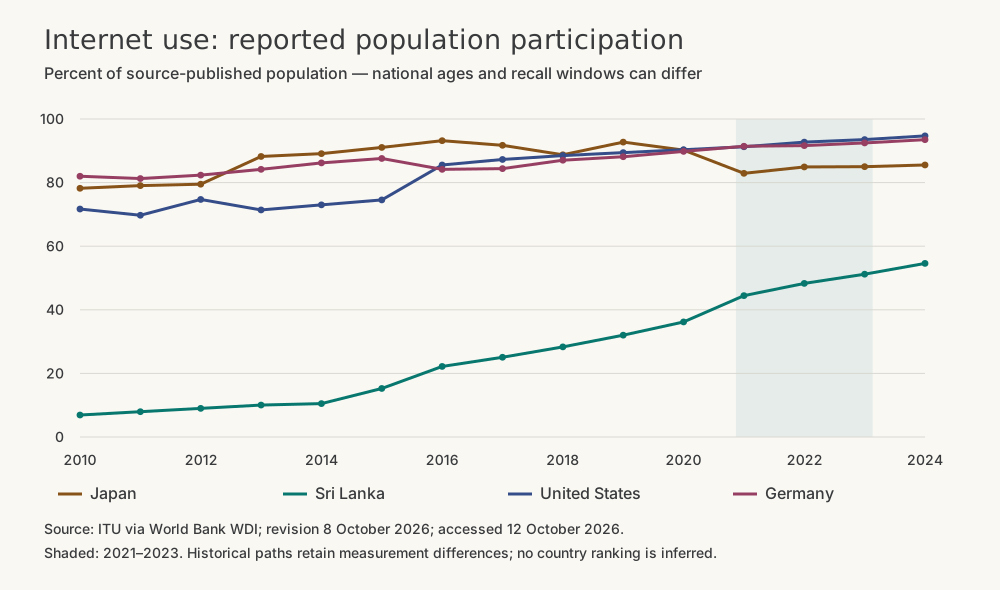
Figure 2. Individual internet use. Percentages retain the publisher’s country populations and methods. Earlier movements, including Japan’s 2020–2021 decrease and the United States’ 2015–2016 increase, are not interpreted as behavioural shocks: historical notes and revisions do not provide a clean decomposition. UNdata historical United States notes attach a six-month recall note to 2015; these older notes remain distinct from the current WDI vintage. Figure 2: individual internet use · Source-linked observations.
Open full-size figure (SVG) · Download source observations (CSV)
Scroll horizontally when needed, or open the full-size figure. The source observations are available as CSV.
The international pattern supports a focused question: what changed in the connections available to people, and what changed in people’s use? A density decline can reflect a changed numerator, population denominator or reporting boundary. Increasing use can coexist with shared connections or several technologies. Establishing any particular mechanism requires evidence that the two international series alone do not contain.
Sri Lanka: why the divergence is not a switching estimate
Sri Lanka’s regulator reports 2,684,307 fixed-broadband subscriptions for 2021 and 2,556,911 for 2023 in its Q2 2026 statistical release—a decrease of 127,396, or 4.7%. Its intermediate 2022 count increases slightly, whereas the WDI density falls. These national counts and the international density cannot be treated as interchangeable observations. Their exact classification, numerator and population-vintage relationship remains unresolved. TRCSL, Telecom Statistics of Sri Lanka — Q2 2026, printed p.8.
A later reporting qualification reinforces that caution. The same regulator table records 2,543,248 fixed subscriptions for 2024 and 1,926,215 for 2025, attributing the reduction to a reporting error by Dialog Broadband Networks. Treating that difference as a clean loss of customers would misread the source. The note concerns the 2025 national series; it does not establish the reason for the earlier WDI decline. Provisional June 2026 fixed subscriptions subsequently stand at 2,020,894. These observations belong to their national series and are not appended to the WDI line.
Thus, rising internet use alongside declining international fixed density is a descriptive result. It does not measure migration to mobile networks, the number of newly connected people, deteriorating service or a causal affordability effect. Smartphone use offers no shortcut: a smartphone can connect through Wi-Fi supplied by fixed broadband.
Sri Lanka’s participation remains uneven
The annual 2025 DCS survey reports internet use by 62.4% of household members aged 5–69, compared with 54.6% in 2024 and 51.2% in 2023. This national measure covers use at least once during twelve months. It remains separate from the WDI series. The annual bulletin supplies the national context used here. Its cover states that 2025 estimates were reweighted using the 2024 Census; the published changes may therefore combine participation changes with revised weights. DCS, Computer Literacy Statistics 2025 — Annual Bulletin, printed p.4, Table 8.
| Population within the DCS survey | 2023 | 2024 | 2025 |
|---|---|---|---|
| Urban | 66.9% | 67.1% | 74.7% |
| Rural | 48.8% | 52.8% | 60.5% |
| Estate | 32.4% | 37.7% | 49.7% |
| Ages 20–24 | 87.2% | 88.4% | 91.6% |
| Ages 60–69 | 15.4% | 17.8% | 24.0% |
In the published estimates, estate-sector use is higher and the urban–estate difference falls from 34.5 to 25.0 percentage points. The 2025 reweighting prevents attributing that entire change to behaviour. The age contrast remained substantial: 67.6 points separated ages 20–24 and 60–69 in 2025. These are differences between rounded survey estimates, without significance tests or observed individual transitions. They locate participation disparities but do not attribute them to one cause. The complete extracted table retains all reported age groups, both sexes and residential sectors.
Japan: household participation and connection choice are separate questions
Japan’s 2025 Communications Usage Trend Survey reports at least one past-year internet user in 89.5% of eligible households. That proportion is 60.6% among households whose head is aged 80 or above and 68.4% among households with annual income below JPY 2 million. The unit is the household: 60.6% is not the internet-use rate of individuals aged 80 or above. The household sample covers households whose head was at least 20 on 1 April 2025; the separate individual module covers members aged six or above. The reference date is the end of August 2025. MIC/e-Stat household internet-use table; survey scope.
The connection table answers a conditional question. Among households with at least one past-year internet user, 76.6% report fixed broadband and 71.5% report mobile-line connections; 58.8% report fibre-to-the-home. Multiple responses are possible. Within the reported weighted survey distribution, the two marginal percentages sum to 148.1% and imply at least about 48% overlap between the categories. This is a calculated lower bound from rounded marginal percentages, not an observed cross-tabulation. Summing the categories as separate households would overcount. They do not measure nationwide shares of mutually exclusive access markets. MIC/e-Stat household connection table.
This is useful counterevidence to an assumption that expanding mobile use necessarily replaces fixed service. The Japanese source establishes coexistence of reported connection categories, while its household participation table shows that access is not universal across household groups. Neither finding proves the causes of Sri Lanka’s trajectory. The national contrasts also use different populations, so their gaps cannot be ranked against Sri Lanka’s individual age or residential-sector differences.
What the comparison establishes
The international evidence identifies four trajectories across two distinct dimensions. National inspection changes how those trajectories should be read. Sri Lanka’s survey reports higher use estimates under revised 2025 weights, with persistent subgroup differences; its regulatory reporting qualification limits an interpretation of subscription losses. Japan’s household measures show why participation and technology choice need different denominators. The United States and Germany provide further observations of joint increases, without enough matched evidence here to infer a shared mechanism.
For policy evaluation, the appropriate outcome is whether defined populations can undertake the activities they need, with suitable reliability and cost. Subscription density supplies a related infrastructure and service-stock measure. Neither becomes a substitute for the other. A useful assessment consequently tracks connections, the people or households using them, and the conditions of use separately.
During the next six months, updated WDI and national releases can test whether the recorded directions persist. A revised fixed-series definition or corrected numerator could weaken the apparent international divergence; renewed survey growth could confirm broader reported participation without resolving its cause. An explanation of switching would require household-level connection transitions, while an explanation of affordability would require comparable costs and resources for the relevant households. These are observable tests, rather than forecasts assigned unsupported probabilities.
Methods, definitions and reuse
The international extract requests four countries, two indicators and sixteen annual periods, 2010–2025. The primary analysis uses 2021–2023, the recent complete joint window; earlier observations support continuity inspection and available 2024 values remain separately labelled. All 128 requested cells are retained, including nine missing observations. No interpolation, forward filling, pooled access score or conversion of subscriptions into unique people is used.
The 12 October refresh uses official WDI CSV downloads labelled 8 October 2026. It reproduces all 119 nonmissing values and the nine missing cells in the retained 23 September extract, whose database revision was 13 July. A database update therefore occurred without changing this selected panel. The downloads provide general country metadata, rather than row-level age, recall or survey-versus-estimate classifications. Those unresolved boundaries remain explicit. Country-specific source changes are not corrected by treating a shared indicator code as identical original measurement.
Absolute differences use unrounded WDI values; fixed-density changes are subscriptions per 100 people and use changes are percentage points. National survey differences use the displayed source precision and carry no claim of statistical significance. Sri Lanka’s 2025 Census-based reweighting limits interpretation of changes against prior annual estimates. The TRCSL comparison retains reported counts; its 2025 reporting-error note is not extrapolated backwards. Japan’s household subgroup and connection measures retain their original conditional denominators.
The observation table, national survey extract, national subscription extract, Japan household extract, definitions, calculations and source register allow each finding to be traced. WDI numeric reuse credits the International Telecommunication Union through World Bank WDI under the series’ CC BY 4.0 terms. Other sources retain their own rights; this statement does not license their complete publications.
This study complements Broadband Access in Sri Lanka, the United States and Germany: What the Numbers Measure, which develops the earlier measurement crosswalk. The present contribution is the separate multi-year subscription/use analysis and its national checks; the earlier work’s identity and edition remain unchanged.
Funding and competing interests
Funding: No report-specific funding declaration is recorded.
Competing interests: No report-specific declaration is recorded.
Evidence cut-off: 12 October 2026. Observation periods and source revision dates remain separately identified above.
For a correction or source update, use the contact page, identifying the affected statement and supporting source.
References
Numbered references correspond to the PDF edition. Descriptive links in the article identify the sources used for individual claims.
- International Telecommunication Union, via World Bank World Development Indicators. 2026-10-08. Fixed broadband subscriptions (per 100 people), IT.NET.BBND.P2. API source CSV; country codes JPN,LKA,USA,DEU; named year columns. Source wdi-fixed. Accessed 2026-10-12. Issued date is the source revision, not the observation year.
- International Telecommunication Union, via World Bank World Development Indicators. 2026-10-08. Individuals using the Internet (% of population), IT.NET.USER.ZS. API source CSV; country codes JPN,LKA,USA,DEU; named year columns. Source wdi-use. Accessed 2026-10-12. Issued date is the source revision, not the observation year.
- World Bank. Metadata glossary: IT.NET.BBND.P2. Long definition; unit; limitations; attribution/licence. Source wdi-fixed-definition. Accessed 2026-10-12. Publication date not established.
- World Bank. Metadata glossary: IT.NET.USER.ZS. Long definition; methodology; limitations; attribution/licence. Source wdi-use-definition. Accessed 2026-10-12. Publication date not established.
- Department of Census and Statistics, Sri Lanka. Computer Literacy Statistics 2025: Annual Bulletin. Cover reweighting note; printed p.4, Tables 8 and 9. Source dcs-annual-2025. Accessed 2026-10-12. Publication date not established.
- Telecommunications Regulatory Commission of Sri Lanka. Telecom Statistics of Sri Lanka — Q2 2026. Printed pp.6–8; section 5, fixed/mobile/satellite subscriptions and 2025 footnote. Source trc-q2-2026. Accessed 2026-10-12. Publication date not established.
- Ministry of Internal Affairs and Communications, Japan, via e-Stat. 2026-05-29. 2025 Communications Usage Trend Survey: household internet-use experience. @Date, @Note, total and household head age 80+ / income under JPY 2 million rows. Source japan-household-use. Accessed 2026-10-12.
- Ministry of Internal Affairs and Communications, Japan, via e-Stat. 2026-05-29. 2025 Communications Usage Trend Survey: household connection type. @Note and total row, columns 6, 9 and 11. Source japan-household-connections. Accessed 2026-10-12.
- Ministry of Internal Affairs and Communications, Japan. 2025 Communications Usage Trend Survey: household survey overview. Printed pp.1–2 and 7–9. Source japan-survey-method. Accessed 2026-10-12. Publication date not established.
- International Telecommunication Union, via United Nations Statistics Division UNdata. 2024-04-04. Percentage of individuals using the internet: historical Japan country notes. Historical country rows and footnotes; source last-update label. Source historical-itu-jpn. Accessed 2026-10-12. Issued date is the source revision, not the observation year.
- International Telecommunication Union, via United Nations Statistics Division UNdata. 2024-04-04. Percentage of individuals using the internet: historical United States country notes. Historical country rows and footnotes; source last-update label. Source historical-itu-usa. Accessed 2026-10-12. Issued date is the source revision, not the observation year.