report
Japan telecommunications: fibre networks, household participation and carrier economics
Japan’s fibre networks, household and individual internet use, wholesale access and carrier economics, with reproducible evidence and clear metric boundaries.
Record details
- Status
- Published
- Published
- Reviewed
- Publisher
- Arachchige Publications
- Author
- Topics
- Japan telecommunications · Japan broadband · internet use Japan · fibre broadband · digital inclusion · wholesale access · carrier economics
Cite this work
Reference tools
How to cite this work
Choose a referencing style, copy the formatted reference, or download citation data for a reference manager.
Citation target. This reference points to the stable arachchi.ge work record.
Selected style APA 7
Arachchige, K. L. (2026). Japan telecommunications: fibre networks, household participation and carrier economics (Version 1.0). Arachchige Publications. https://www.arachchi.ge/works/japan-telecommunications-industry/
APA 7 is shown by default. The citation files below remain available when interactive controls are unavailable.
Download citation data
Arachchige, K. L. (2026). Japan telecommunications: fibre networks, household participation and carrier economics (Version 1.0). Arachchige Publications. https://www.arachchi.ge/works/japan-telecommunications-industry/
Arachchige, K.L. (2026) Japan telecommunications: fibre networks, household participation and carrier economics. Arachchige Publications. Available at: https://www.arachchi.ge/works/japan-telecommunications-industry/.
Arachchige, Kushan Liyana. 2026. Japan Telecommunications: Fibre Networks, Household Participation and Carrier Economics. Version 1.0. Arachchige Publications. https://www.arachchi.ge/works/japan-telecommunications-industry/.
Arachchige, Kushan Liyana. Japan Telecommunications: Fibre Networks, Household Participation and Carrier Economics. Version 1.0, Arachchige Publications, 12 Oct. 2026, https://www.arachchi.ge/works/japan-telecommunications-industry/.
[1] K. L. Arachchige, “Japan telecommunications: fibre networks, household participation and carrier economics,” Arachchige Publications, Oct. 2026. [Online]. Available: https://www.arachchi.ge/works/japan-telecommunications-industry/
1. Arachchige KL. Japan telecommunications: fibre networks, household participation and carrier economics [Internet]. Arachchige Publications; 2026 Oct. Available from: https://www.arachchi.ge/works/japan-telecommunications-industry/
Abstract
Japan’s extensive telecommunications networks do not imply uniform individual participation. This audit examines fixed and mobile subscription stocks, household connectivity, individual internet use, wholesale supply and bounded carrier economics using original government tables and issuer disclosures inspected on 12 October 2026. June 2026 contract data are kept separate from the August 2025 household survey and from quarterly company accounts. Fibre represents 79.3% of fixed broadband contracts, a technology mix that does not measure household coverage. Communications modules account for approximately 74.1% of annual net additions to adjusted mobile contracts, showing why subscription growth cannot be interpreted as growth in unique users. The survey reports at least one past-year internet user in 89.5% of households, while individual use among people aged 80 or above is 37.1% on a separate denominator excluding nonresponse. Fixed and mobile connections overlap among user households. Wholesale disclosures demonstrate the distinction between retail brands and access-network dependence, and carrier results show why group revenue, service revenue, revenue per user and profitability require their own reporting boundaries. A selected broadband configuration illustrates the need to identify access, internet service provider and equipment charges. The contribution is a reproducible account of supply, participation and commercial measures without combining unlike populations. The evidence supports testable priorities for usable household service and consistent economic reporting. It does not establish causal affordability effects, realised service-quality rankings, comprehensive regulatory effects or environmental outcomes.
Scholarly PDF
Download scholarly PDF · v1.0Cite this version when referring to the PDF. Check this article for corrections and later editions.
Data and figures
Data edition e01/s00
Source-linked subscription, participation and carrier observations, with calculation lineage, source vintages and population boundaries.
Research status
Evidence checked through . Methodology 1.1.0 · Coverage and limitations · Edition record.
On this page
Japan’s telecommunications challenge is increasingly about converting extensive networks into useful participation. Fibre accounts for roughly four-fifths of fixed broadband subscriptions, but that supply statistic does not tell us which households connect, which people use the internet or what service they experience. Large participation differences in the official survey concern older people and lower-income households. These are demand and inclusion questions as well as infrastructure questions.
Three findings shape this audit. First, connectivity measures describe different populations: contracts, households and individuals cannot be combined into one penetration rate. Second, the market supports overlapping fixed and mobile connections and extensive wholesale supply. Retail brand counts therefore give an incomplete picture of infrastructure dependence. Third, revenue growth and higher reported revenue per user need to be separated from customer growth, telecom service growth and operating profitability. The observed carrier results supply examples of each distinction.
Scope and evidence
The market examined here is public fixed and mobile telecommunications access in Japan. The audit examines subscription stocks, household connectivity, individual internet participation, retail delivery and bounded carrier economics. It excludes enterprise IT, finance and media from market-size claims even where those activities appear in a carrier group’s accounts. Corporate results are used to explain the market’s economics; this is not a set of company capability assessments.
Evidence was checked on 12 October 2026. MIC’s release of 25 September supplies stocks at 30 June 2026. The household survey refers to the end of August 2025 and was released on 29 May 2026. Carrier operating and financial comparisons principally cover the April–June quarter of 2025 and 2026. These separate clocks remain visible throughout. Reading the survey in October does not make it an October observation.
Fibre dominates subscriptions; wholesale supply changes the competitive picture
At June 2026, MIC reported 52.57 million fixed broadband contracts, including 41.67 million fibre-to-the-home (FTTH) contracts. FTTH consequently represents 79.3% of that subscription stock. The total increased by about 1.2% from June 2025. This is a market substantially supplied by fibre, but neither ratio measures the share of homes passed or the share of households buying fibre. MIC’s FTTH definition also includes very-high-bit-rate digital subscriber line (VDSL) within apartment buildings. (MIC contract tables; MIC definitions)
NTT East and West’s fixed broadband share is 11.5% on the direct basis and 44.5% when wholesale provision is included. The distinction matters for understanding routes to market: a competing retail service can still depend on an incumbent access network. NTT’s separate operating disclosure reports 24.035 million FLETS contracts including Hikari Collaboration, of which 17.992 million are Collaboration contracts. The latter is a nested 74.9% subset, not another stock to add to the total. These two disclosures use their own defined scopes; the NTT subset should not be presented as a national retail share. (MIC contract tables; NTT data book)
Wholesale access can support retail variety without implying equivalent infrastructure independence. The evidence does not establish that wholesale dependence causes poor service or excessive prices. It identifies where service delivery and competition assessment need to look beyond the visible brand: access provision, ISP service, installation, in-home equipment and the contract assigning responsibility for faults.
The fixed broadband series also needs a historical boundary. MIC’s earlier totals do not include the same fixed wireless categories used from March 2024. An unqualified long-run growth chart would combine changes in reporting scope with changes in contracts. This audit therefore uses June 2025–June 2026 for its comparable headline growth calculation. (MIC contract tables; MIC definitions)
Growth in mobile contracts is not growth in the number of people connected
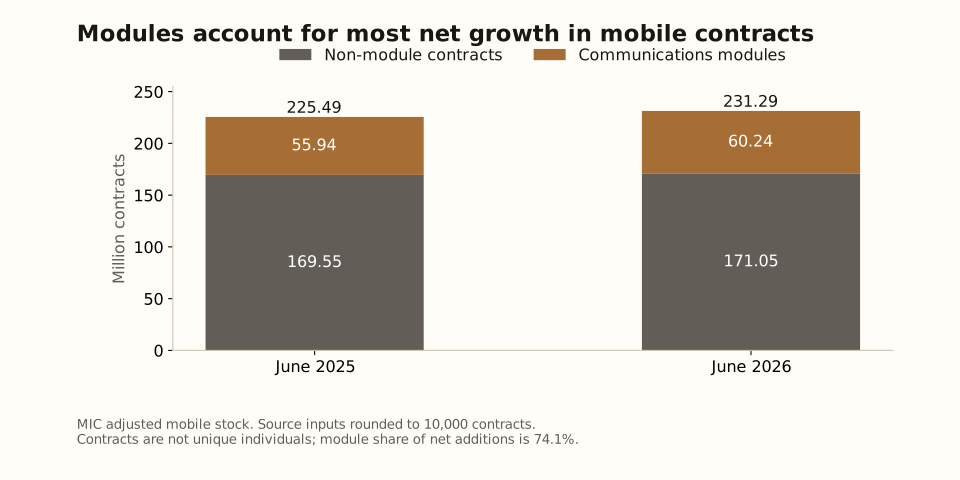
MIC’s adjusted mobile stock was 231.29 million at June 2026. Communications modules accounted for 60.24 million and the non-module category for 171.05 million. Modules contributed approximately 74.1% of the year-on-year increase in adjusted contracts. Over the latest quarter, module contracts rose while non-module contracts fell. (MIC contract tables; MIC definitions)
This decomposition changes the reading of market expansion. A rising headline stock can reflect machine connections as well as additional personal use. The non-module category still counts contracts, not unique people. MIC’s simple aggregate is larger because its counting treatment differs; it should not be substituted for the adjusted stock to suggest greater adoption.
The direct mobile shares also differ from shares that include MVNO supply relationships. Those alternatives answer different questions about retail participation and network provision. Their rounded values should not be forced into an exact 100% total or blended into a single concentration score. The audit does not rank network performance from either measure. (MIC contract tables; MIC definitions)
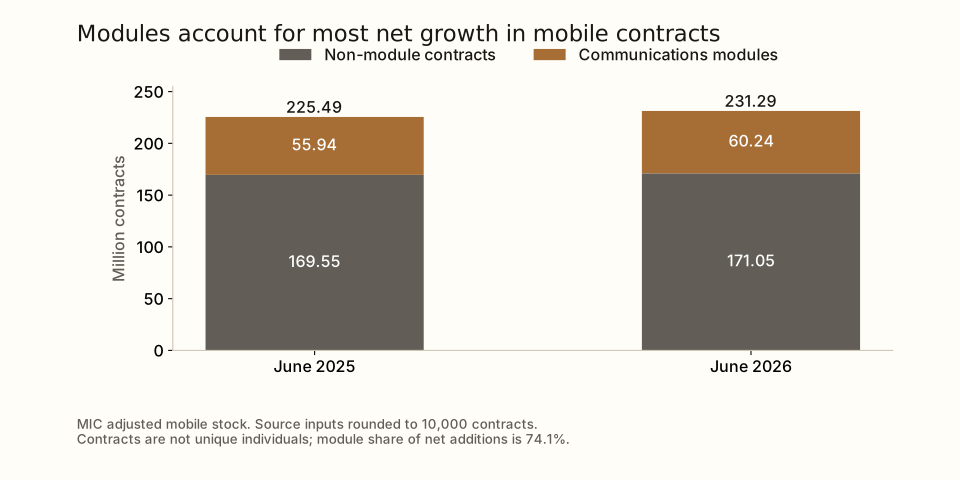
Figure 1. Modules account for most net growth in mobile contracts
Figure 1. Mobile contract mix. MIC adjusted stock separates communications modules and non-module contracts. Inputs are rounded to 10,000 contracts; neither category counts unique people. Figure 1: mobile contract mix · Source observations.
Open full-size figure (SVG) · Download source observations (CSV) · Original edition figure (SVG)
Scroll horizontally when needed, or open the full-size figure. The source observations are available as CSV.
Household access and individual participation answer different questions
The 2025 Communications Usage Trend Survey found that 89.5% of households had at least one member who had used the internet during the previous year. This is a broad household participation measure. It does not mean that every member used the internet, that the household had a fixed subscription or that service was adequate. (survey methodology; household-use table)
The survey sampled households whose head was aged at least 20 on 1 April 2025. Its individual module covers members aged six and above. The latter condition does not exclude households with younger children. There were 17,916 valid household responses from 40,592 sampled households, with 1,184 invalid cases; the official response rate, which removes invalid cases from its denominator, is 45.5%. Results are weighted. Response patterns and subgroup uncertainty remain relevant even after that adjustment. (survey methodology)
| Population and measure | Reported result | Interpretation |
|---|---|---|
| All eligible households: at least one past-year internet user | 89.5% | Any use by at least one member |
| Households with a head aged 80+: same measure | 60.6% | Household-head age, not individual-user age |
| Households with annual income below JPY 2 million: same measure | 68.4% | Income association; not an estimated price effect |
| Individuals aged six and above, excluding nonrespondents: past-year internet use | 85.7% | Individual participation |
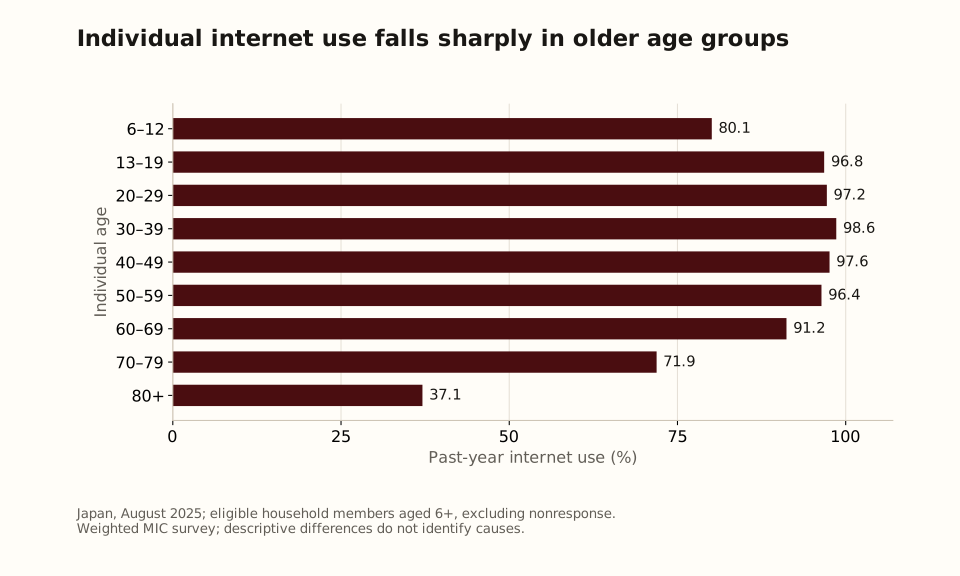
| Individuals aged 80+, excluding nonrespondents: same measure | 37.1% | Direct evidence of lower use among the oldest respondents |
The individual measure is particularly consequential. Household connectivity can coexist with non-use by an older member. Conversely, someone can use the internet outside a home without the household buying a fixed line. The household and individual figures should remain separate rather than being subtracted as though they were observations of the same population. (household-use table; individual-use table)
Income and age differences identify where more detailed diagnosis has value. They do not isolate the effects of price, skills, disability, preference, housing or assistance from relatives. Nor does the survey establish that a particular intervention would close the gap. A defensible programme would combine connection measures with individual use, task completion and the reasons people do not participate.
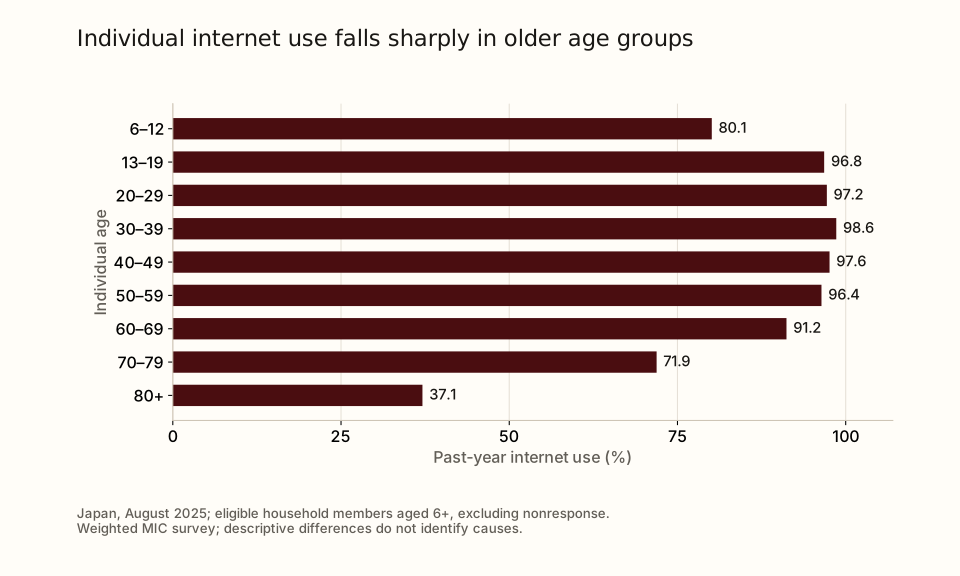
Figure 2. Individual internet use falls sharply in older age groups
Figure 2. Individual internet use by age. Japan, August 2025; weighted eligible household members aged six and above, excluding nonresponse. Age differences are descriptive. Figure 2: individual internet use by age · Source observations.
Open full-size figure (SVG) · Download source observations (CSV) · Original edition figure (SVG)
Scroll horizontally when needed, or open the full-size figure. The source observations are available as CSV.
Fixed and mobile access coexist within connected households
Among households with at least one past-year internet user, 76.6% reported fixed broadband connections and 71.5% mobile connections; 58.8% reported FTTH. These are multiple-response figures on a conditional denominator. They are not competing slices of all Japanese households. (connection table)
Because fixed and mobile shares use the same user-household base, they imply that at least about 48% of those households reported both. This is a mathematical lower bound from rounded marginal percentages, not an observed estimate of the joint share. It nevertheless rejects the assumption that fixed and mobile are mutually exclusive household choices.
Within this connected-household group, the low-income category reported fixed broadband at 53.9% and FTTH at 38.7%, while mobile connections were 65.8%. Among households whose head was 80 or above, 10.5% reported no internet-line contract. These observations indicate differences in connection arrangements. They do not tell us whether a mobile-only arrangement is inadequate, whether a contract belongs to another household member, or why the respondent reported no contract. (connection table)
The practical question is therefore which combination of access, devices and support meets a household’s needs. A policy or commercial offer aimed only at selling another line may miss the distinction between network availability, adoption and effective use.
The home broadband offer is a chain of contracts and equipment
A selected NTT West/Asahi Net example makes the delivery chain concrete. The undiscounted FLETS Hikari Cross access fee is JPY 6,930 a month, with internet service provider (ISP) service charged separately. Asahi Net lists JPY 1,320 a month for its corresponding ISP service; NTT West lists an optional router rental at JPY 550. Together those selected recurring components total JPY 8,800 including tax, before the separate universal-service charge. NTT West states that its listed prices include tax unless indicated otherwise. This is an illustration of this offer configuration, not a national price average or a cheapest-provider finding. (NTT West service terms; Asahi Net service terms; NTT West tax convention)
Discounts alter the price path. NTT West lists a conditional access discount for the first 24 months and a different amount from month 25. Installation, address eligibility, equipment and cancellation terms therefore belong beside the advertised monthly amount. The nominal 10Gbps specification is a technical maximum, not evidence of realised household throughput. (NTT West service terms)
This example supports a limited operational conclusion: a useful offer comparison needs to state which parties supply access and internet service, which charges are included, whether equipment is optional, and when prices change. It does not establish affordability. That requires household resources, the relevant bundle of services and devices, and a defensible treatment of differing needs.
Carrier economics require comparisons within consistent boundaries
A carrier group’s growth is not automatically growth in telecommunications services. NTT DOCOMO Group’s April–June revenue rose from JPY 1,490.1 billion in 2025 to JPY 1,617.0 billion in 2026, an 8.5% increase. In the same workbook, telecom service revenue moved from JPY 819.9 billion to JPY 818.2 billion, a 0.2% decline. The different direction is a reason to keep group and service boundaries separate, rather than treating the larger growth figure as a measure of the access market. (NTT data book)
Within NTT’s regional communications disclosure, fibre-related revenue increased by 1.6% while legacy revenue declined by 4.9% over the same quarters. This is consistent with a transition in the revenue mix. It does not identify the independent effect of prices, customer counts or cost reductions. (NTT data book)
KDDI’s current Telecom Core series shows mobile communication revenue rising from JPY 469.843 billion to JPY 491.472 billion, or 4.6%. Its disclosure separately reports main contracts, smartphone contracts and connected-solutions contracts. Smartphone history contains corrections, and the current segment series includes reclassification. Reusing the current historical series avoids combining incompatible old and new presentations. Adjusted operating income remains an issuer-defined measure. (KDDI data book)
SoftBank Corp.’s Consumer segment recorded JPY 749.7 billion in revenue, up 4% year on year, while operating income was JPY 152.9 billion, down 1%, according to its earnings summary. Its operating table reports higher average revenue per user (ARPU) alongside a lower main-contract count than a year earlier. Management links ARPU growth to its plan mix and service initiatives. That is a company explanation, not a measured causal decomposition or proof of improved customer experience. (SoftBank operating data; SoftBank earnings summary)
Rakuten makes the profitability boundary especially visible. For April–June 2026, Rakuten Mobile reported JPY 101.3 billion of revenue, positive earnings before interest, taxes, depreciation and amortisation (EBITDA) of JPY 5.9 billion and an operating loss on its non-GAAP (generally accepted accounting principles) basis of JPY 32.3 billion. The broader Mobile segment reported different revenue and loss figures. Positive EBITDA does not eliminate the operating loss, and neither measure alone establishes the return on future network investment. The quarter’s JPY 39.3 billion network capital expenditure is an input, not observed coverage or quality. (Rakuten results)
ARPU definitions prevent a responsible cross-carrier league table. DOCOMO excludes specified modules and wholesale categories; SoftBank’s measure includes value-added services and a broadband discount; Rakuten’s net ARPU uses a narrower contract denominator and ecosystem adjustments. These figures can illuminate each issuer’s own development after checking revisions. They do not establish who charges most, supplies most value or has the strongest margins.
What the evidence implies for competition and inclusion
The most credible opportunities follow from the measured distinctions. First, service propositions can focus on reliable household use rather than headline speed alone. This is an analytical proposition, supported by the separation between subscription stock and participation; it is not a measured estimate of demand for any particular support product. A relevant test would track activation, continuing use and successful completion of common tasks among the intended group.
Second, transparent coordination across the access provider, ISP and equipment provider can reduce uncertainty in the buying process. The fixed-line example demonstrates why the allocation of responsibilities and total recurring charges matter. Whether such coordination improves retention requires outcome evidence beyond the present disclosures.
Third, operators and policymakers should distinguish growth in connected modules from growth in personal participation. Both can be commercially or socially useful. Confusing them risks setting the wrong success measure: a machine connection can raise network stock without changing an older person’s ability to use a service.
The corresponding risks are equally specific. High average connectivity can conceal groups with substantially lower participation. Retail variety can conceal shared infrastructure dependencies. Higher reported ARPU can be misread as higher customer value, while expanding group revenue can conceal slower service revenue. None of these risks establishes misconduct or deficient capability by a named company.
The audit proposes three testable critical success factors: deliver a complete and understandable service at the household level; support use among the intended customer group; and maintain economic reporting that separates the service, population and cost measures behind growth. Their observable indicators are full recurring and initial charges, installation and fault-resolution outcomes, continued individual use, and consistently defined service revenue and investment measures. Their importance is an analytical inference. Relative weights and predictive effects have not been estimated.
Outlook and limits
The evidence supports monitoring three directions rather than a numerical forecast: the mix of fixed access technologies; the balance of module and non-module mobile contracts; and the conversion of household connectivity into individual use. A subsequent survey could show whether age and income differences narrow. A subsequent quarter could show whether contract and service-revenue directions persist. Neither development is assumed here.
The main unresolved evidence concerns realised quality and outages, the causes of non-use, comprehensive affordability, current sector-wide policy effects and environmental impacts. The audit does not rank countries or carriers, attribute the observed differences to a single cause, estimate total industry revenue by adding corporate groups, claim universal fibre access or validate companies’ internal capabilities. Supply, participation and selected carrier economics are supported at their stated boundaries; broader welfare and causal conclusions remain outside them.
MIC releases, the next household survey, revised issuer tables and material tariff or regulatory changes should trigger review. The next research checkpoint is planned for 26 October 2026; it is not an asserted official release date. NTT’s current calendar lists its next results on 4 November and Rakuten’s calendar lists 13 November, both subject to later checking. No future results have been incorporated.
Reuse and corrections
The source-linked observations, calculation lineage and source register preserve periods, units, populations, original source locators and qualifications. The calculations reproduce stated descriptive arithmetic; they do not establish causal effects. Source publications retain their own rights.
For a correction or source update, use the contact page, identifying the affected statement and supporting evidence.
Funding and competing interests
Funding: No report-specific funding declaration is recorded.
Competing interests: No report-specific declaration is recorded.
Methodology and evidence coverage
Market boundary
Japan as defined by MIC national statistics and the household survey.
Included activities
- Connectivity supply, adoption and use
- Supporting wholesale routes
- Bounded carrier economic context
Excluded activities
- National group-revenue aggregation
- Internal company capabilities
Changes in this edition
- First Japan methodology1.1 bounded external audit: separate contracts, households, individuals and issuer economics.
- Explicit conditional connection denominator, source-native historical break, wholesale subsets and selected tariff exclusions.
- Regulatory effects, realised service quality, comprehensive affordability, environmental and causal conclusions remain excluded.
Earlier publication dates and correction notices remain part of this work's history.
Framework coverage
| Module | Coverage | Evidence limitation |
|---|---|---|
| E0 · Identity, decision use and market boundary | complete | See the module analysis. |
| E1 · Market baseline and development | partial | Total industry revenue, unique-household coverage and unbridged historical growth are not established. These inferences are excluded, so the supported remaining account does not depend on this gap. |
| E2 · Macroenvironment | partial | Causal macro drivers, comprehensive affordability and environmental/energy effects are not established. These inferences are excluded, so the supported remaining account does not depend on this gap. |
| E3 · Policy, regulation and stakeholders | partial | Current comprehensive operative regulation and implementation effects require separate primary-instrument research. These inferences are excluded, so the supported remaining account does not depend on this gap. |
| E4 · Industry structure and economics | partial | Uniform cross-issuer efficiency, adjusted profit, ARPU and market valuation are not established. These inferences are excluded, so the supported remaining account does not depend on this gap. |
| E5 · Customers, segments and demand | partial | Reasons for non-use, causal price/skills effects and intervention benefits are not identified. These inferences are excluded, so the supported remaining account does not depend on this gap. |
| E6 · Routes to market, suppliers and partners | partial | Representative offers, channel margins, installation/support outcomes and full affordability are not measured. These inferences are excluded, so the supported remaining account does not depend on this gap. |
| E7 · Competition, alternatives and positioning | partial | Address-level independent alternatives, market power, cheapest offer and quality rankings are not established. These inferences are excluded, so the supported remaining account does not depend on this gap. |
| E8 · Innovation, technology and transition | partial | Realised quality, resilience, environmental results and causal technology effects are not established. These inferences are excluded, so the supported remaining account does not depend on this gap. |
| E9 · Outlook, uncertainty and scenarios | complete | See the module analysis. |
| E10 · Opportunities, threats and critical success factors | complete | See the module analysis. |
| E11 · Limitations, monitoring and review | complete | See the module analysis. |
Material evidence limitations
- Unique people, households, homes passed, universal fibre availability or end-to-end fibre inside each dwelling inferred from MIC contract stocks.
- Like-for-like long-run fixed/mobile growth across the pre-March2024 fixed-wireless reporting boundary without a compatible bridge.
- All-household penetration, mutually exclusive technology shares or an observed fixed/mobile joint share inferred from the conditional multiple-response connection table.
- Individual age or use assigned from household-head strata, all-member use inferred from one household user, or unobserved children/nonrespondents added to individual survey coverage. Causal effects of prices, skills, disability, housing or policy on participation; predictive or intervention effects of age/income associations.
- National telecom market value, carrier efficiency/profit/ARPU rankings or industry revenue totals obtained by pooling issuer groups, segments or non-uniform measures. Internal company capability, misconduct or welfare rankings inferred from public aggregate disclosures.
- National retail market share inferred from the nested Hikari Collaboration share, or independent local network choice inferred from retail brands or national shares.
- National average price, cheapest offer, all-in bill or affordability conclusion from the selected NTT West/Asahi Net recurring components; excluded charges are not zero.
- Current comprehensive operative legal/regulatory findings, legal compliance or measured reform effects without reviewed operative instruments.
- Realised speed, quality, outage resilience, support or installation outcomes inferred from nominal technology, capital expenditure or provider descriptions.
- Environmental/energy effects.
- Environmental/energy effects, numerical market forecasts, investment returns or measured causal CSF weights not supported by the admitted evidence.
- Do not present inspection dates as observation or publication dates, or current undated offers as historical tariff trends.
Conclusions this evidence cannot support
- Unique people, households, homes passed, universal fibre availability or end-to-end fibre inside each dwelling inferred from MIC contract stocks.
- Like-for-like long-run fixed/mobile growth across the pre-March2024 fixed-wireless reporting boundary without a compatible bridge.
- All-household penetration, mutually exclusive technology shares or an observed fixed/mobile joint share inferred from the conditional multiple-response connection table.
- Individual age or use assigned from household-head strata, all-member use inferred from one household user, or unobserved children/nonrespondents added to individual survey coverage.
- Causal effects of prices, skills, disability, housing or policy on participation; predictive or intervention effects of age/income associations.
- National telecom market value, carrier efficiency/profit/ARPU rankings or industry revenue totals obtained by pooling issuer groups, segments or non-uniform measures.
- National retail market share inferred from the nested Hikari Collaboration share, or independent local network choice inferred from retail brands or national shares.
- National average price, cheapest offer, all-in bill or affordability conclusion from the selected NTT West/Asahi Net recurring components; excluded charges are not zero.
- Current comprehensive operative legal/regulatory findings, legal compliance or measured reform effects without reviewed operative instruments.
- Realised speed, quality, outage resilience, support or installation outcomes inferred from nominal technology, capital expenditure or provider descriptions.
- Environmental/energy effects, numerical market forecasts, investment returns or measured causal CSF weights not supported by the admitted evidence.
- Internal company capability, misconduct or welfare rankings inferred from public aggregate disclosures.
References
Numbered references correspond to the PDF edition. Descriptive links in the article identify the sources used for individual claims.
- Ministry of Internal Affairs and Communications, Japan. 2026-09-25. MIC FY2026 Q1 telecommunications subscriptions and shares. PDF pp1–2 mobile stocks and pp8–9 fixed broadband; values reported in ten-thousand contracts. Source mic-june-quarter; inspected 12 October 2026. Reference period remains distinct from release.
- Ministry of Internal Affairs and Communications, Japan. 2026-09-25. MIC FY2026 Q1 definitions and notes. FTTH, fixed broadband, adjusted mobile, MNO/MVNO and communications-module definitions. Source mic-june-definitions; inspected 12 October 2026. Reference period remains distinct from release.
- Ministry of Internal Affairs and Communications, Japan. 2026-05-29. MIC 2025 Communications Usage Trend Survey household overview. Printed pp.1–2,7–9.. Source survey-method; inspected 12 October 2026. Reference period remains distinct from release.
- Ministry of Internal Affairs and Communications, Japan. 2026-05-29. MIC/e-Stat 2025 household internet-use experience. @Date; @Note; column names; household total and named rows. Publication date confirmed in e-Stat listing 29 May 2026.. Source household-use; inspected 12 October 2026. Reference period remains distinct from release.
- Ministry of Internal Affairs and Communications, Japan. 2026-05-29. MIC/e-Stat 2025 household connection type. @Date; @Note; total row and headers.. Source household-connection; inspected 12 October 2026. Reference period remains distinct from release.
- Ministry of Internal Affairs and Communications, Japan. 2026-05-29. 2025 Communications Usage Trend Survey: past-year individual internet use. e-Stat 000040458827; all-sex age block, excluding nonrespondents. Source individual-use; inspected 12 October 2026. Reference period remains distinct from release.
- NTT / NTT West. 2026-08-06. NTT June 2026 supplementary results. Sheet 11 P 15, sheet 12 P 19/P 22, sheet 13 O 7. Definitions sheet 11 F 46:F 48, sheet 12 notes 2–5, sheet 13 notes 1–4. Released 6 August 2026.. Source ntt-data; inspected 12 October 2026. Reference period remains distinct from release.
- KDDI. 2026-08-07. KDDI FY 2027.3 Q 1 Data Book. Printed p.8, definitions p.12, segments p.13. Published 7 August 2026. Page 8 visually inspected.. Source kddi-data; inspected 12 October 2026. Reference period remains distinct from release.
- SoftBank Corp.. Soft Bank Corp principal operating data via company-linked Stock Weather iframe. Number of mobile subscribers and churn rates; ARPU table; notes 1–3. Official entry https://www.softbank.jp/en/corp/ir/financials/kpi/ .. Source softbank-data; inspected 12 October 2026. Publication date not established; inspection is not publication.
- SoftBank Corp.. 2026-08-04. SoftBank Corp. Q1 FY2026 earnings summary. Consumer segment revenue and operating income; management explanation for ARPU. Source softbank-results-summary; inspected 12 October 2026. Reference period remains distinct from release.
- Rakuten. 2026-08-10. Rakuten Group Q 2 FY 2026 results highlights. Mobile Segment; notes 9–12; published 10 August 2026.. Source rakuten-data; inspected 12 October 2026. Reference period remains distinct from release.
- NTT / NTT West. NTT West FLETS Hikari Cross English service and fees. Monthly fee, ISP exclusion, router fee, initial expenses, discount and cancellation terms. Source ntt-west-cross; inspected 12 October 2026. Publication date not established; inspection is not publication.
- Asahi Net. Asahi Net FLETS Hikari Cross English service and fees. Monthly ISP fee and separate NTT line requirement. Source asahi-cross; inspected 12 October 2026. Publication date not established; inspection is not publication.
- NTT / NTT West. NTT West English website tax-inclusive price convention. Listed prices and cancellation fees include tax unless otherwise stated. Source ntt-west-tax; inspected 12 October 2026. Publication date not established; inspection is not publication.
- NTT / NTT West. NTT IR calendar. FY 2026 November scheduled entry.. Source ntt-calendar; inspected 12 October 2026. Publication date not established; inspection is not publication.
- Rakuten. Rakuten IR calendar. Upcoming Event and 2026 list.. Source rakuten-calendar; inspected 12 October 2026. Publication date not established; inspection is not publication.